
- Start >
- Rivers >
- Discharge >
- Isar >
- Ampermoching >
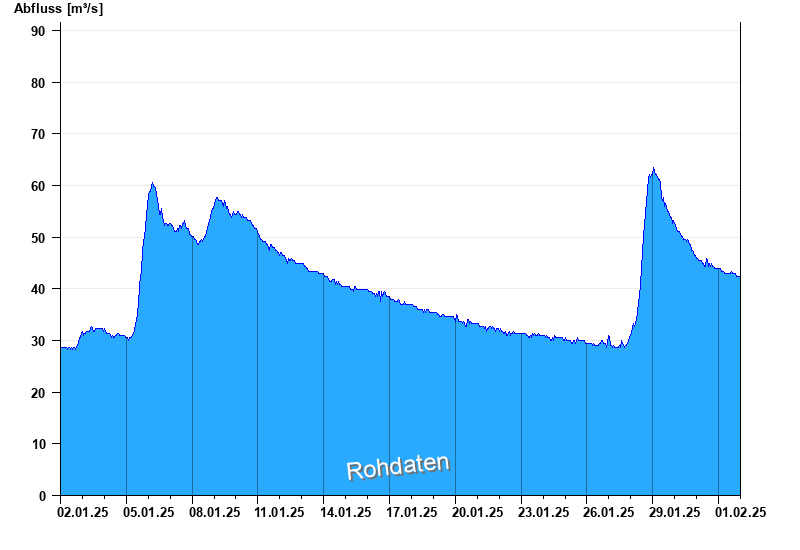
- Chart of month

Chart of month Ampermoching / Amper
Discharge from 02.01.2025 to 01.02.2025
- 25.05.1999 Abfluss: 171 m³/s
- 03.06.2013 Abfluss: 150 m³/s
- 13.04.1994 Abfluss: 123 m³/s
- 23.08.2005 Abfluss: 116 m³/s
- 22.09.2000 Abfluss: 112 m³/s
| Date | Runoff [m³/s] |
|---|---|
| 01.02.2025 23:45 | 42.4 |
| 01.02.2025 23:30 | 42.4 |
| 01.02.2025 23:15 | 42.4 |
| 01.02.2025 23:00 | 42.4 |
| 01.02.2025 22:45 | 42.4 |
| 01.02.2025 22:30 | 42.4 |
| 01.02.2025 22:15 | 42.4 |
© Bayerisches Landesamt für Umwelt 2025