
- Start >
- Rivers >
- Discharge >
- Isar >
- Au b. Bad Aibling >
- Chart of year

Chart of year Au b. Bad Aibling / Aubach
Discharge from 26.04.2024 to 25.04.2025
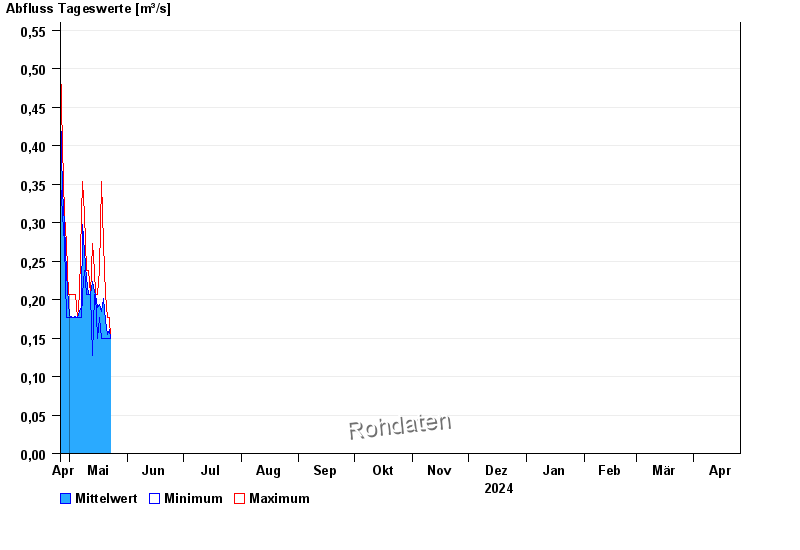
| Date | Mean value [m³/s] | Maximum [m³/s] | Minimum [m³/s] |
|---|---|---|---|
| 12.07.2024 | 0.219 | 0.593 | 0.182 |
| 11.07.2024 | 0.248 | 0.417 | 0.182 |
| 10.07.2024 | 0.256 | 0.874 | 0.133 |
| 09.07.2024 | 0.164 | 0.182 | 0.133 |
| 08.07.2024 | 0.202 | 0.244 | 0.156 |
| 07.07.2024 | 0.22 | 0.28 | 0.156 |
| 06.07.2024 | 0.175 | 0.211 | 0.156 |
© Bayerisches Landesamt für Umwelt 2024