

Chart of year Bad Trißl / Auerbach
Discharge from 12.08.2020 to 11.08.2021
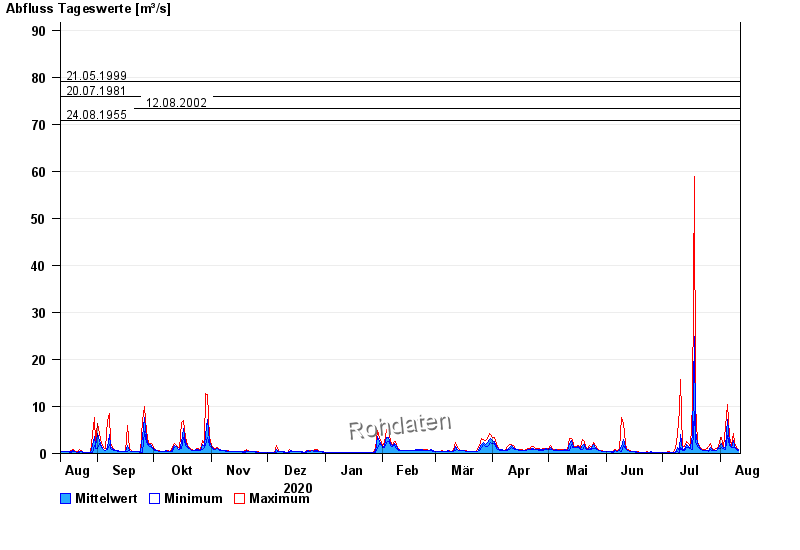
- 31.07.1977 Abfluss: 90,6 m³/s
- 21.05.1999 Abfluss: 79 m³/s
- 20.07.1981 Abfluss: 75,8 m³/s
- 12.08.2002 Abfluss: 73,3 m³/s
- 24.08.1955 Abfluss: 70,9 m³/s
| Date | Mean value [m³/s] | Maximum [m³/s] | Minimum [m³/s] |
|---|---|---|---|
| 11.08.2021 | 1.02 | 1.16 | 0.927 |
| 10.08.2021 | 1.34 | 1.56 | 1.16 |
| 09.08.2021 | 2.04 | 2.73 | 1.56 |
| 08.08.2021 | 3.62 | 5.44 | 1.71 |
| 07.08.2021 | 1.83 | 2.19 | 1.56 |
| 06.08.2021 | 3.18 | 4.68 | 2.19 |
| 05.08.2021 | 8.37 | 11.2 | 4.68 |
© Bayerisches Landesamt für Umwelt 2024