
- Start >
- Rivers >
- Discharge >
- Isar >
- Bad Wiessee >
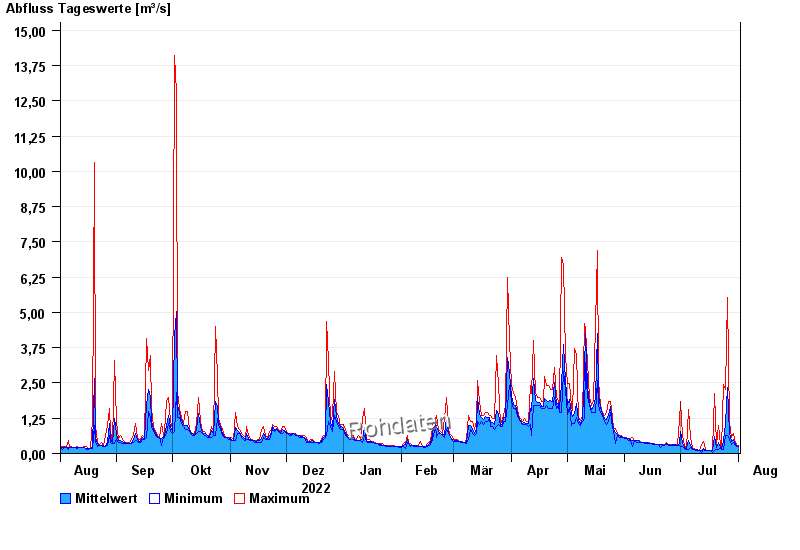
- Chart of year

Chart of year Bad Wiessee / Söllbach
Discharge from 02.08.2022 to 01.08.2023
| Date | Mean value [m³/s] | Maximum [m³/s] | Minimum [m³/s] |
|---|---|---|---|
| 01.08.2023 | 0.257 | 0.279 | 0.237 |
| 31.07.2023 | 0.277 | 0.326 | 0.237 |
| 30.07.2023 | 0.381 | 0.497 | 0.326 |
| 29.07.2023 | 0.483 | 0.716 | 0.378 |
| 28.07.2023 | 0.417 | 0.564 | 0.326 |
| 27.07.2023 | 0.691 | 1.1 | 0.497 |
| 26.07.2023 | 2.35 | 5.54 | 0.638 |
© Bayerisches Landesamt für Umwelt 2024