

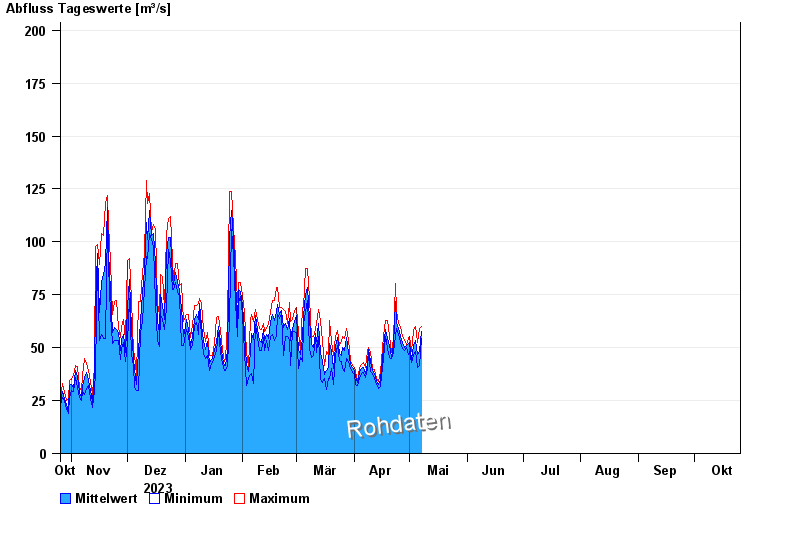
Chart of year Beuerberg / Loisach
Discharge from 26.10.2023 to 25.10.2024
- 24.05.1999 Abfluss: 319 m³/s
- 23.08.2005 Abfluss: 310 m³/s
- 03.06.2013 Abfluss: 300 m³/s
- 10.08.1970 Abfluss: 281 m³/s
- 18.06.1979 Abfluss: 280 m³/s
| Date | Mean value [m³/s] | Maximum [m³/s] | Minimum [m³/s] |
|---|---|---|---|
| 20.10.2024 | 45.9 | 49.4 | 42.6 |
| 19.10.2024 | 55.3 | 63.7 | 47.9 |
| 18.10.2024 | 58.9 | 63.7 | 55.1 |
| 17.10.2024 | 53 | 56.7 | 49.4 |
| 16.10.2024 | 60.2 | 72 | 55.1 |
| 15.10.2024 | 71.3 | 73.7 | 68.6 |
| 14.10.2024 | 59.7 | 73.7 | 49.4 |
© Bayerisches Landesamt für Umwelt 2024