
- Start >
- Rivers >
- Discharge >
- Isar >
- Dürnhausen >
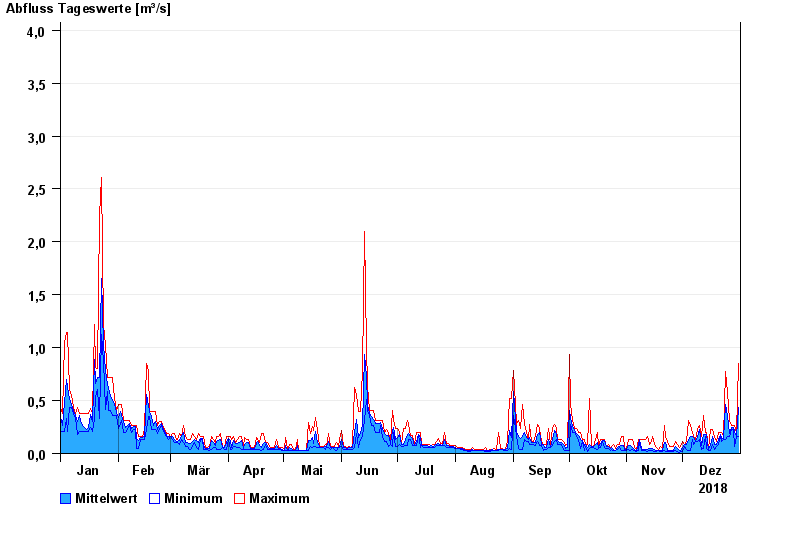
- Chart of year

Chart of year Dürnhausen / Lothdorfer Bach
Discharge from 01.01.2018 to 31.12.2018
note
Messwerte beeinflusst durch Kraftwerkssteuerung.
- 22.05.1999 Abfluss: 14,3 m³/s
- 06.06.1968 Abfluss: 12,8 m³/s
- 02.07.2020 Abfluss: 12,3 m³/s
- 18.06.1979 Abfluss: 12,3 m³/s
- 05.06.2011 Abfluss: 10,6 m³/s
| Date | Mean value [m³/s] | Maximum [m³/s] | Minimum [m³/s] |
|---|---|---|---|
| 31.12.2018 | 0.436 | 0.848 | 0.163 |
| 30.12.2018 | 0.164 | 0.194 | 0.163 |
| 29.12.2018 | 0.208 | 0.267 | 0.069 |
| 28.12.2018 | 0.241 | 0.267 | 0.229 |
| 27.12.2018 | 0.247 | 0.267 | 0.229 |
| 26.12.2018 | 0.192 | 0.309 | 0.163 |
| 25.12.2018 | 0.361 | 0.572 | 0.163 |
© Bayerisches Landesamt für Umwelt 2025