

Chart of year Erb / Leitzach
Discharge from 01.11.2020 to 31.10.2021
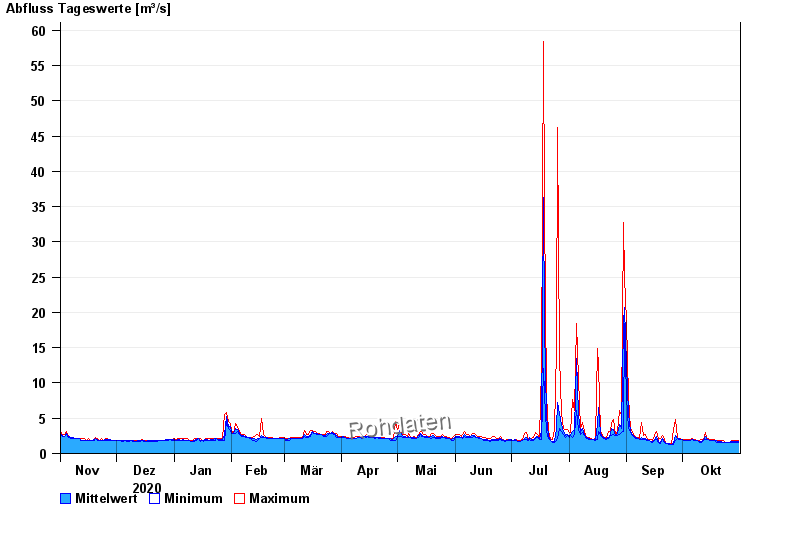
| Date | Mean value [m³/s] | Maximum [m³/s] | Minimum [m³/s] |
|---|---|---|---|
| 31.10.2021 | 1.69 | 1.78 | 1.62 |
| 30.10.2021 | 1.73 | 1.78 | 1.62 |
| 29.10.2021 | 1.74 | 1.78 | 1.62 |
| 28.10.2021 | 1.7 | 1.78 | 1.62 |
| 27.10.2021 | 1.71 | 1.78 | 1.62 |
| 26.10.2021 | 1.62 | 1.62 | 1.62 |
| 25.10.2021 | 1.62 | 1.62 | 1.62 |
© Bayerisches Landesamt für Umwelt 2024