

Chart of year Freising / Isar
Discharge from 26.09.2020 to 25.09.2021
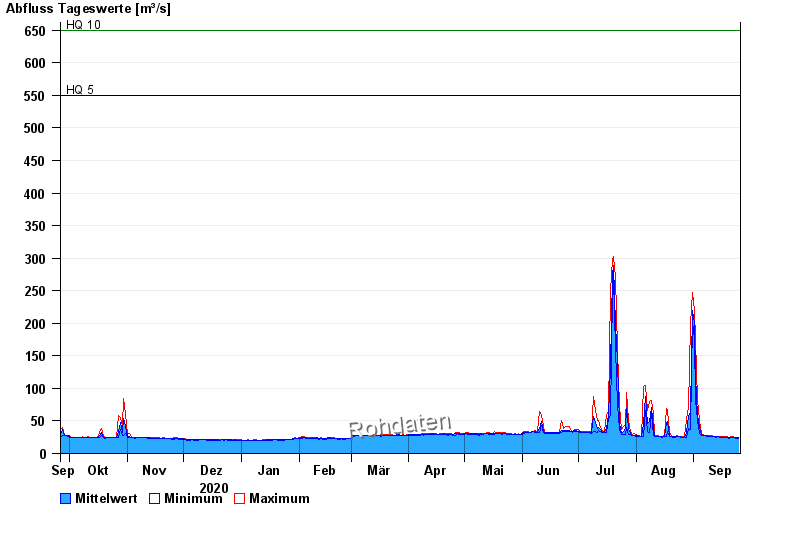
- HQ5 550 m³/s
- HQ10 650 m³/s
- HQ20 750 m³/s
- HQ100 1050 m³/s
| Date | Mean value [m³/s] | Maximum [m³/s] | Minimum [m³/s] |
|---|---|---|---|
| 25.09.2021 | 26.8 | 27.1 | 26.3 |
| 24.09.2021 | 27.1 | 27.5 | 26.5 |
| 23.09.2021 | 27.4 | 27.7 | 26.8 |
| 22.09.2021 | 27.5 | 28.3 | 27 |
| 21.09.2021 | 27.5 | 28.1 | 27 |
| 20.09.2021 | 27.2 | 27.8 | 26.5 |
| 19.09.2021 | 27.5 | 28 | 27 |
© Bayerisches Landesamt für Umwelt 2024