

Chart of year Freising / Schleifermoosach
Discharge from 04.03.2020 to 03.03.2021
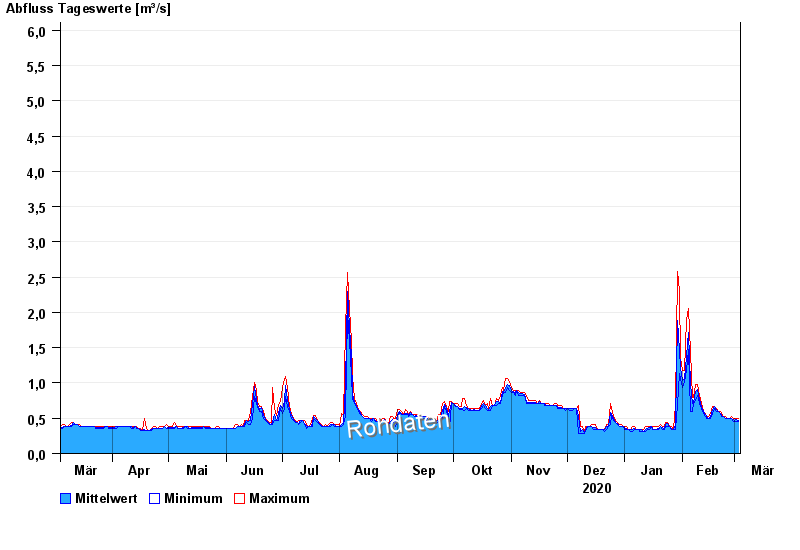 Für diesen Pegel sind keine Jährlichkeiten hinterlegt.
| Date | Mean value [m³/s] | Maximum [m³/s] | Minimum [m³/s] |
|---|---|---|---|
| 03.03.2021 | 0.474 | 0.504 | 0.439 |
| 02.03.2021 | 0.486 | 0.504 | 0.475 |
| 01.03.2021 | 0.481 | 0.494 | 0.472 |
| 28.02.2021 | 0.48 | 0.495 | 0.448 |
| 27.02.2021 | 0.5 | 0.521 | 0.491 |
| 26.02.2021 | 0.495 | 0.517 | 0.485 |
| 25.02.2021 | 0.505 | 0.515 | 0.496 |
© Bayerisches Landesamt für Umwelt 2024