
- Start >
- Rivers >
- Discharge >
- Isar >
- Großschwindau >
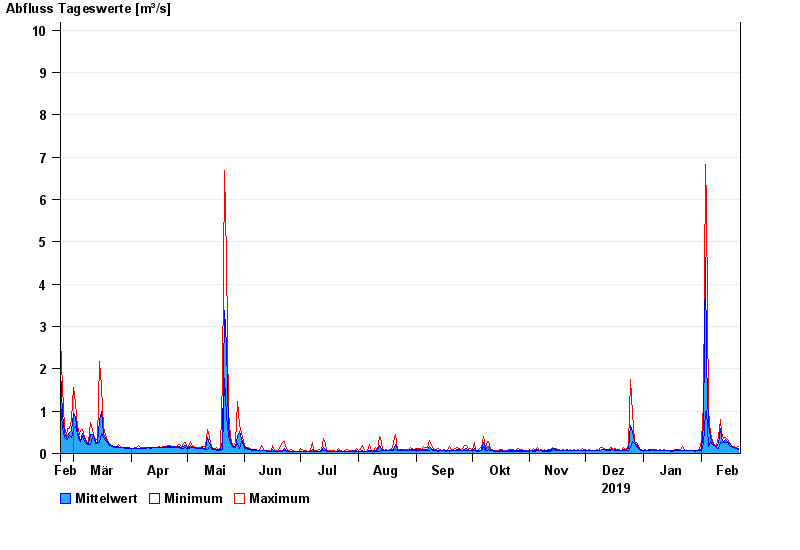
- Chart of year

Chart of year Großschwindau / Goldach
Discharge from 22.02.2019 to 21.02.2020
- 15.02.1990 Abfluss: 22,5 m³/s
- 03.08.1991 Abfluss: 22,1 m³/s
- 01.08.1991 Abfluss: 21,8 m³/s
- 09.06.1965 Abfluss: 20,1 m³/s
- 22.06.1965 Abfluss: 19,5 m³/s
| Date | Mean value [m³/s] | Maximum [m³/s] | Minimum [m³/s] |
|---|---|---|---|
| 21.02.2020 | 0.119 | 0.155 | 0.104 |
| 20.02.2020 | 0.12 | 0.131 | 0.117 |
| 19.02.2020 | 0.136 | 0.161 | 0.131 |
| 18.02.2020 | 0.151 | 0.177 | 0.146 |
| 17.02.2020 | 0.181 | 0.195 | 0.161 |
| 16.02.2020 | 0.226 | 0.251 | 0.195 |
| 15.02.2020 | 0.294 | 0.338 | 0.251 |
© Bayerisches Landesamt für Umwelt 2024