
- Start >
- Rivers >
- Discharge >
- Isar >
- Hohenkammer >
- Chart of year

Chart of year Hohenkammer / Glonn
Discharge from 01.01.2024 to 31.12.2024
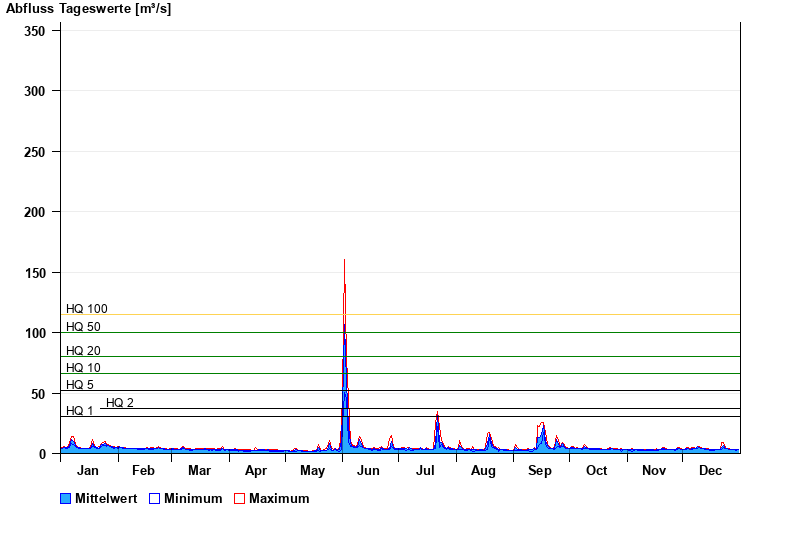
- HQ1 33 m³/s
- HQ2 41 m³/s
- HQ5 52 m³/s
- HQ10 66 m³/s
- HQ20 80 m³/s
- HQ50 100 m³/s
- HQ100 115 m³/s
| Date | Mean value [m³/s] | Maximum [m³/s] | Minimum [m³/s] |
|---|---|---|---|
| 31.12.2024 | 3.2 | 3.35 | 2.97 |
| 30.12.2024 | 3.19 | 3.35 | 2.74 |
| 29.12.2024 | 3.37 | 3.61 | 2.97 |
| 28.12.2024 | 3.31 | 3.61 | 2.97 |
| 27.12.2024 | 3.34 | 3.47 | 3.22 |
| 26.12.2024 | 3.54 | 3.74 | 3.22 |
| 25.12.2024 | 3.88 | 4.16 | 3.74 |
© Bayerisches Landesamt für Umwelt 2025