

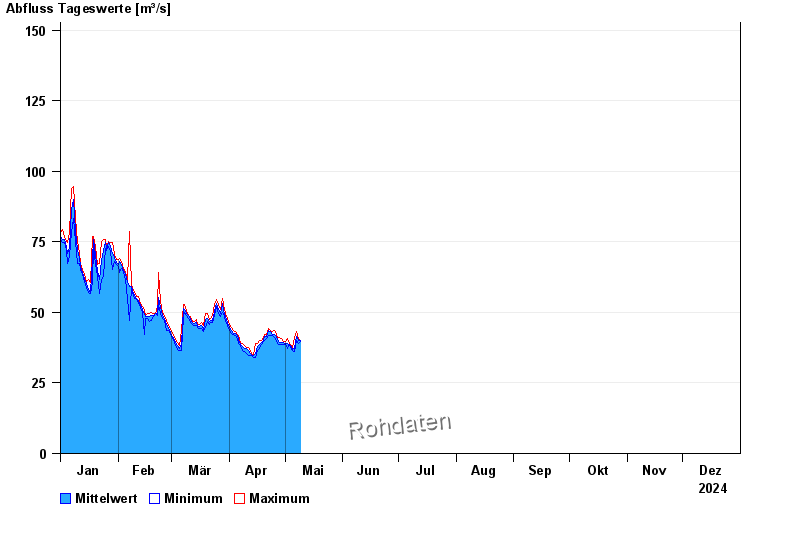
Chart of year Inkofen / Amper
Discharge from 01.01.2024 to 31.12.2024
- 15.04.1994 Abfluss: 249 m³/s
- 01.06.1940 Abfluss: 242 m³/s
- 11.07.1954 Abfluss: 240 m³/s
- 04.06.2013 Abfluss: 238 m³/s
- 13.06.1965 Abfluss: 223 m³/s
| Date | Mean value [m³/s] | Maximum [m³/s] | Minimum [m³/s] |
|---|---|---|---|
| 31.12.2024 | 41.8 | 42.6 | 41.6 |
| 30.12.2024 | 43.5 | 44.7 | 43.1 |
| 29.12.2024 | 44.6 | 45.8 | 43.7 |
| 28.12.2024 | 45.5 | 46.8 | 44.7 |
| 27.12.2024 | 47 | 48.4 | 45.8 |
| 26.12.2024 | 49.4 | 51.1 | 47.9 |
| 25.12.2024 | 52.2 | 53.8 | 51.1 |
© Bayerisches Landesamt für Umwelt 2025