
- Start >
- Rivers >
- Discharge >
- Isar >
- Manching (Ort) >
- Chart of year

Chart of year Manching (Ort) / Paar
Discharge from 01.01.2020 to 31.12.2020
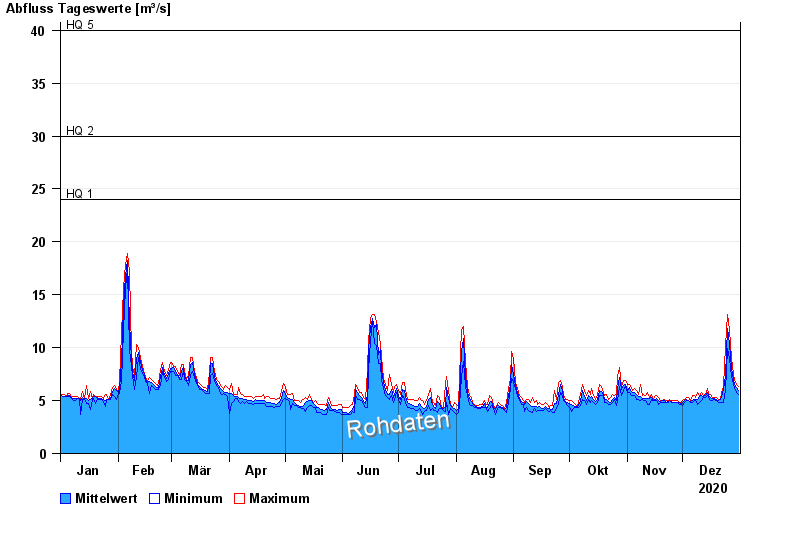
- HQ1 24 m³/s
- HQ2 30 m³/s
- HQ5 40 m³/s
- HQ10 49 m³/s
- HQ20 60 m³/s
- HQ50 77 m³/s
- HQ100 92 m³/s
| Date | Mean value [m³/s] | Maximum [m³/s] | Minimum [m³/s] |
|---|---|---|---|
| 31.12.2020 | 5.91 | 6.3 | 5.57 |
| 30.12.2020 | 6.2 | 6.49 | 5.74 |
| 29.12.2020 | 6.55 | 6.88 | 6.11 |
| 28.12.2020 | 7.02 | 7.5 | 6.49 |
| 27.12.2020 | 8.09 | 9.13 | 7.08 |
| 26.12.2020 | 10.6 | 12.1 | 9.13 |
| 25.12.2020 | 12.3 | 13.7 | 10.2 |
© Bayerisches Landesamt für Umwelt 2025