
- Start >
- Rivers >
- Discharge >
- Isar >
- Manching (Ort) >
- Chart of year

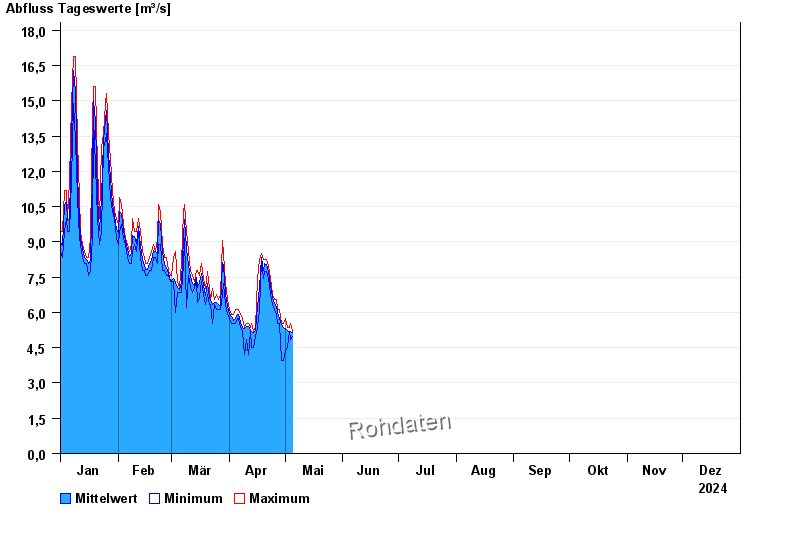
Chart of year Manching (Ort) / Paar
Discharge from 01.01.2024 to 31.12.2024
| Date | Mean value [m³/s] | Maximum [m³/s] | Minimum [m³/s] |
|---|---|---|---|
| 23.11.2024 | 8.28 | 8.4 | 8.21 |
| 22.11.2024 | 8.92 | 9.5 | 8.21 |
| 21.11.2024 | 9.61 | 9.95 | 9.26 |
| 20.11.2024 | 8.48 | 9.5 | 7.99 |
| 19.11.2024 | 7.68 | 7.99 | 7.42 |
| 18.11.2024 | 7.32 | 7.42 | 6.89 |
| 17.11.2024 | 7.28 | 7.62 | 7.06 |
© Bayerisches Landesamt für Umwelt 2024