

Chart of month Moosburg / Isar
Discharge from 01.07.2021 to 30.07.2021
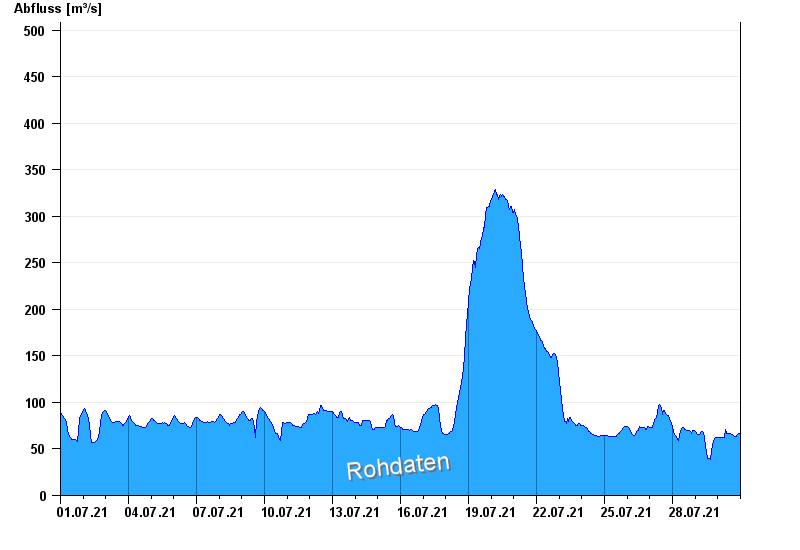
- Abfluss: m³/s
- Abfluss: m³/s
- Abfluss: m³/s
- Abfluss: m³/s
- Abfluss: m³/s
| Date | Runoff [m³/s] |
|---|---|
| 31.07.2021 00:45 | 66 |
| 31.07.2021 00:30 | 67.2 |
| 31.07.2021 00:15 | 67.2 |
| 31.07.2021 00:00 | 67.2 |
| 30.07.2021 23:45 | 67.2 |
| 30.07.2021 23:30 | 67.2 |
| 30.07.2021 23:15 | 67.2 |
© Bayerisches Landesamt für Umwelt 2024