

Chart of year Moosburg / Isar
Discharge from 26.09.2022 to 25.09.2023
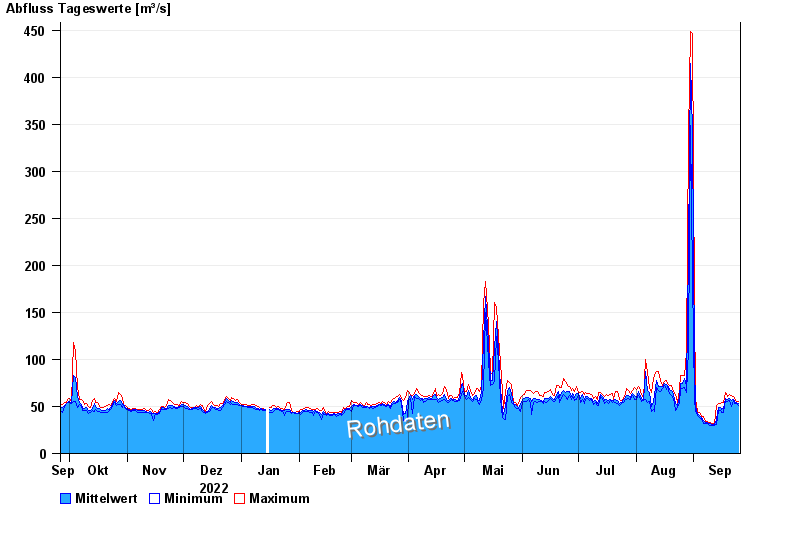
| Date | Mean value [m³/s] | Maximum [m³/s] | Minimum [m³/s] |
|---|---|---|---|
| 25.09.2023 | 53 | 55.2 | 51.1 |
| 24.09.2023 | 54.1 | 55.2 | 53.2 |
| 23.09.2023 | 55.5 | 58.3 | 53.2 |
| 22.09.2023 | 57.8 | 60.5 | 56.2 |
| 21.09.2023 | 56.7 | 61.5 | 50.2 |
| 20.09.2023 | 58.7 | 62.7 | 56.2 |
| 19.09.2023 | 57.4 | 60.5 | 55.2 |
© Bayerisches Landesamt für Umwelt 2024