

Chart of year Moosburg / Isar
Discharge from 27.10.2022 to 26.10.2023
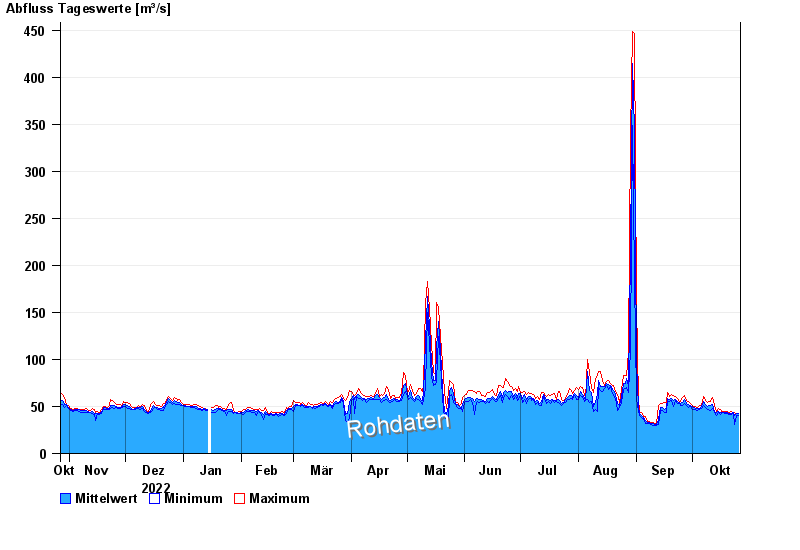
| Date | Mean value [m³/s] | Maximum [m³/s] | Minimum [m³/s] |
|---|---|---|---|
| 26.10.2023 | 42.2 | 42.7 | 40.9 |
| 25.10.2023 | 42 | 42.7 | 40.9 |
| 24.10.2023 | 40.1 | 43.6 | 30.5 |
| 23.10.2023 | 43.1 | 43.6 | 42.7 |
| 22.10.2023 | 43 | 44.5 | 41.8 |
| 21.10.2023 | 42.8 | 43.6 | 41.8 |
| 20.10.2023 | 43.5 | 44.5 | 42.7 |
© Bayerisches Landesamt für Umwelt 2024