

Chart of year Mühlthal / Glonn
Discharge from 11.08.2020 to 10.08.2021
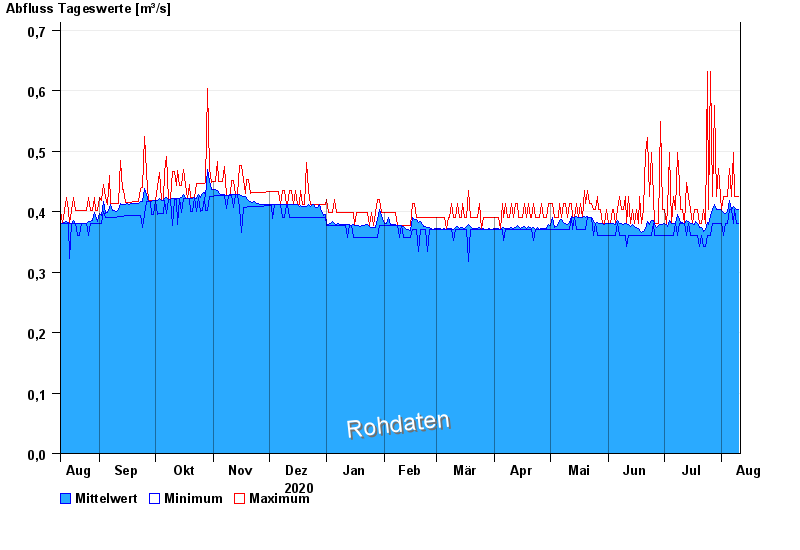
| Date | Mean value [m³/s] | Maximum [m³/s] | Minimum [m³/s] |
|---|---|---|---|
| 10.08.2021 | 0.403 | 0.425 | 0.381 |
| 09.08.2021 | 0.403 | 0.425 | 0.381 |
| 08.08.2021 | 0.406 | 0.425 | 0.403 |
| 07.08.2021 | 0.408 | 0.497 | 0.381 |
| 06.08.2021 | 0.404 | 0.425 | 0.403 |
| 05.08.2021 | 0.418 | 0.472 | 0.403 |
| 04.08.2021 | 0.401 | 0.425 | 0.381 |
© Bayerisches Landesamt für Umwelt 2024