
- Start >
- Rivers >
- Discharge >
- Isar >
- Obermenzing >
- Chart of year

Chart of year Obermenzing / Würm
Discharge from 01.01.2024 to 31.12.2024
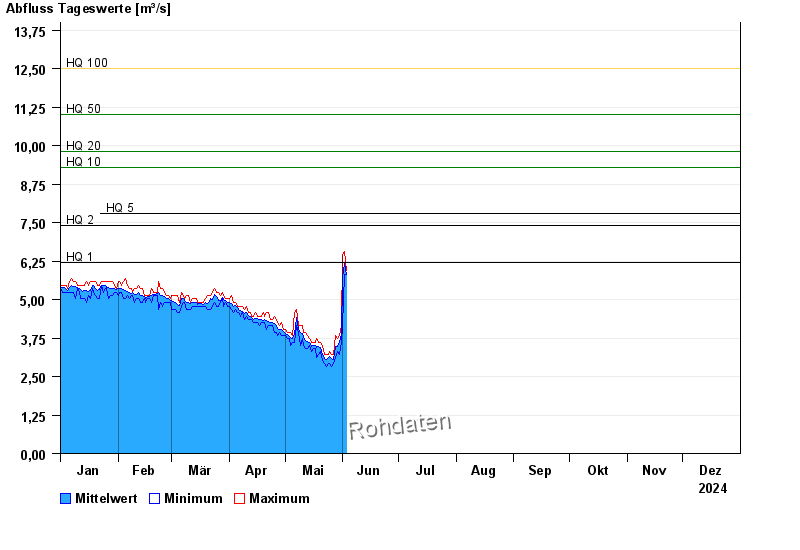
- HQ1 6,2 m³/s
- HQ2 7,4 m³/s
- HQ5 7,8 m³/s
- HQ10 9,3 m³/s
- HQ20 9,8 m³/s
- HQ50 11 m³/s
- HQ100 12,5 m³/s
| Date | Mean value [m³/s] | Maximum [m³/s] | Minimum [m³/s] |
|---|---|---|---|
| 17.08.2024 | 5.81 | 5.84 | 5.72 |
| 16.08.2024 | 5.8 | 5.96 | 5.6 |
| 15.08.2024 | 5.85 | 5.96 | 5.84 |
| 14.08.2024 | 6.04 | 6.33 | 5.72 |
| 13.08.2024 | 6.41 | 7.21 | 6.09 |
| 12.08.2024 | 6.75 | 6.96 | 6.09 |
| 11.08.2024 | 6.74 | 6.84 | 6.09 |
© Bayerisches Landesamt für Umwelt 2024