
- Start >
- Rivers >
- Discharge >
- Isar >
- Obermühlhausen >
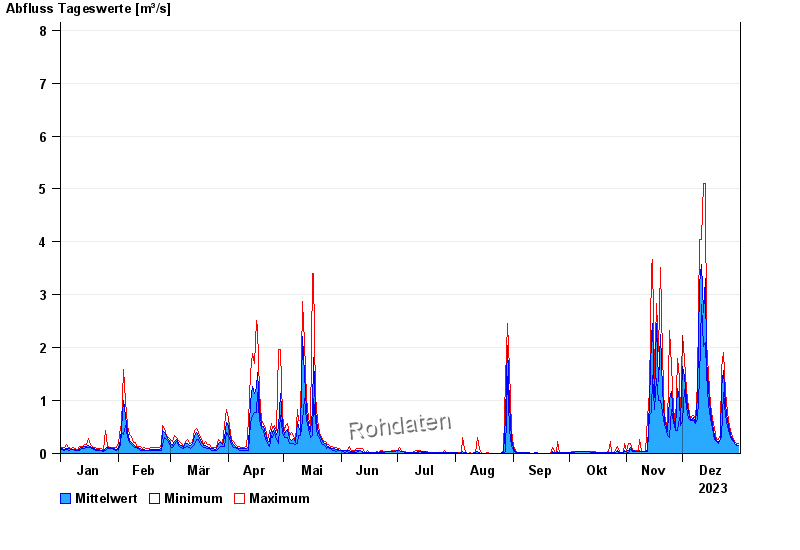
- Chart of year

Chart of year Obermühlhausen / Windach
Discharge from 01.01.2023 to 31.12.2023
- 21.05.1999 Abfluss: 25,6 m³/s
- 06.08.2000 Abfluss: 21,3 m³/s
- 01.06.2024 Abfluss: 19,5 m³/s
- 02.06.2013 Abfluss: 18,8 m³/s
- 18.06.1979 Abfluss: 18,7 m³/s
| Date | Mean value [m³/s] | Maximum [m³/s] | Minimum [m³/s] |
|---|---|---|---|
| 31.12.2023 | 0.175 | 0.203 | 0.169 |
| 30.12.2023 | 0.181 | 0.203 | 0.169 |
| 29.12.2023 | 0.208 | 0.239 | 0.202 |
| 28.12.2023 | 0.249 | 0.277 | 0.238 |
| 27.12.2023 | 0.318 | 0.406 | 0.277 |
| 26.12.2023 | 0.467 | 0.551 | 0.406 |
| 25.12.2023 | 0.672 | 0.82 | 0.551 |
© Bayerisches Landesamt für Umwelt 2025