

Chart of year Obernach / Ach
Discharge from 19.04.2024 to 18.04.2025
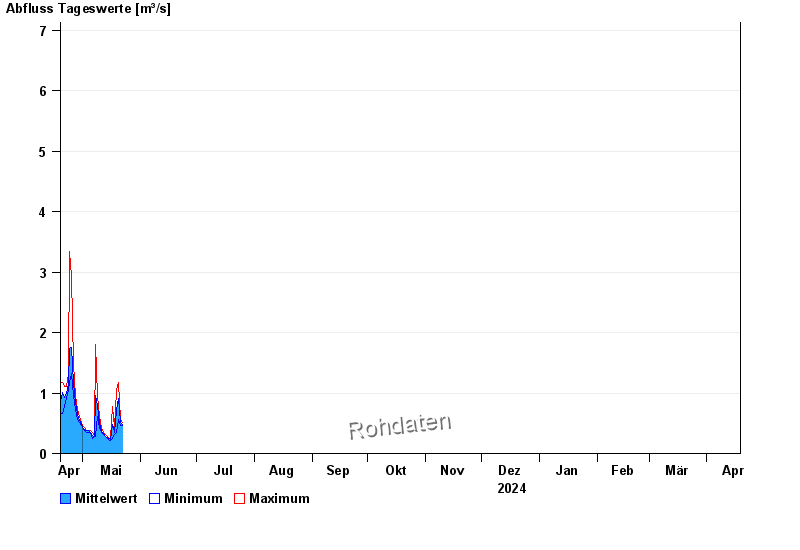
note
Wasserstandsaufzeichnung möglicherweise durch Vereisung verfälscht.
- HQ1 25 m³/s
- HQ2 32 m³/s
- HQ5 38 m³/s
- HQ10 45 m³/s
- HQ20 52 m³/s
- HQ50 63 m³/s
- HQ100 70 m³/s
| Date | Mean value [m³/s] | Maximum [m³/s] | Minimum [m³/s] |
|---|---|---|---|
| 22.01.2025 | 0.174 | 0.291 | 0.131 |
| 21.01.2025 | 0.212 | 0.262 | 0.188 |
| 20.01.2025 | 0.239 | 0.357 | 0.188 |
| 19.01.2025 | 0.232 | 0.291 | 0.149 |
| 18.01.2025 | 0.262 | 0.262 | 0.262 |
| 17.01.2025 | 0.283 | 0.323 | 0.262 |
| 16.01.2025 | 0.354 | 0.394 | 0.291 |
© Bayerisches Landesamt für Umwelt 2025