

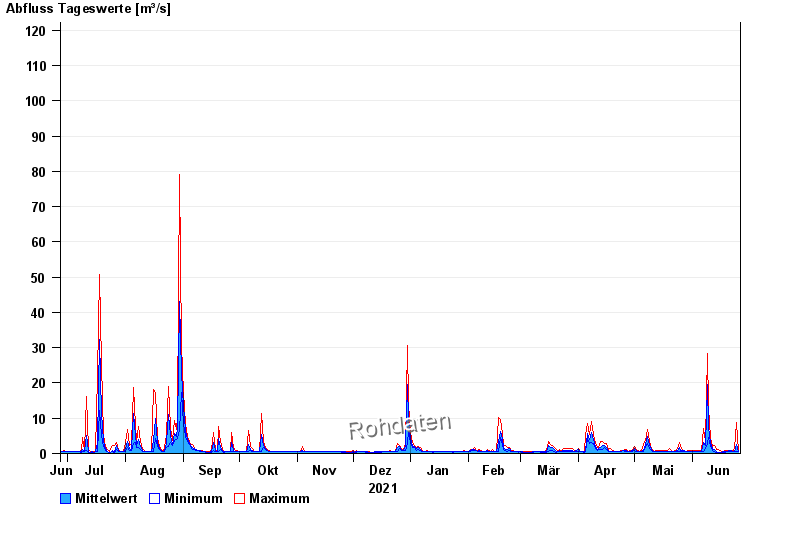
Chart of year Prien / Prien
Discharge from 27.06.2021 to 26.06.2022
- 31.07.1924 Abfluss: 180 m³/s
- 01.01.1940 Abfluss: 165 m³/s
- 02.06.2013 Abfluss: 163 m³/s
- 12.08.2002 Abfluss: 160 m³/s
- 03.06.2010 Abfluss: 135 m³/s
| Date | Mean value [m³/s] | Maximum [m³/s] | Minimum [m³/s] |
|---|---|---|---|
| 26.06.2022 | 0.646 | 0.672 | 0.616 |
| 25.06.2022 | 2.69 | 8.8 | 0.672 |
| 24.06.2022 | 0.666 | 1.38 | 0.562 |
| 23.06.2022 | 0.636 | 0.855 | 0.562 |
| 22.06.2022 | 0.735 | 0.855 | 0.562 |
| 21.06.2022 | 0.719 | 0.855 | 0.562 |
| 20.06.2022 | 0.674 | 0.991 | 0.562 |
© Bayerisches Landesamt für Umwelt 2024