

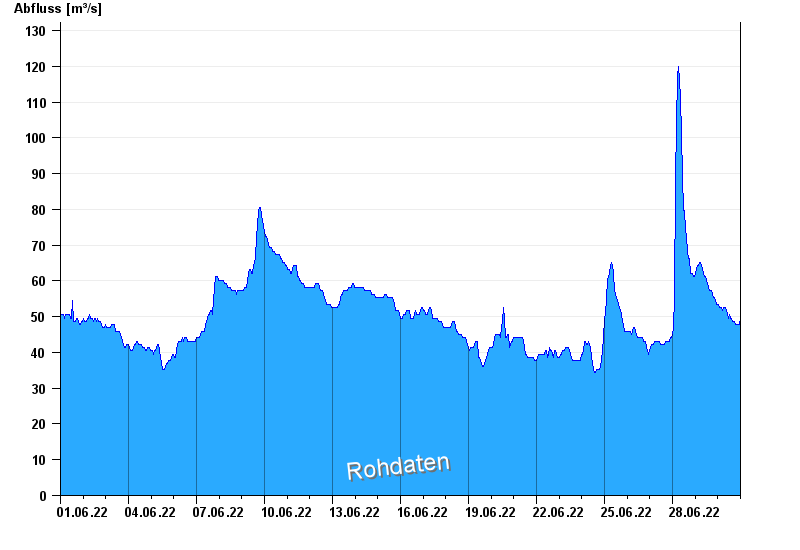
Chart of month Puppling / Isar
Discharge from 01.06.2022 to 30.06.2022
| Date | Runoff [m³/s] |
|---|---|
| 01.07.2022 00:45 | 83.9 |
| 01.07.2022 00:30 | 80.6 |
| 01.07.2022 00:15 | 71.3 |
| 01.07.2022 00:00 | 58.2 |
| 30.06.2022 23:45 | 49.6 |
| 30.06.2022 23:30 | 47.8 |
| 30.06.2022 23:15 | 47.8 |
© Bayerisches Landesamt für Umwelt 2025