

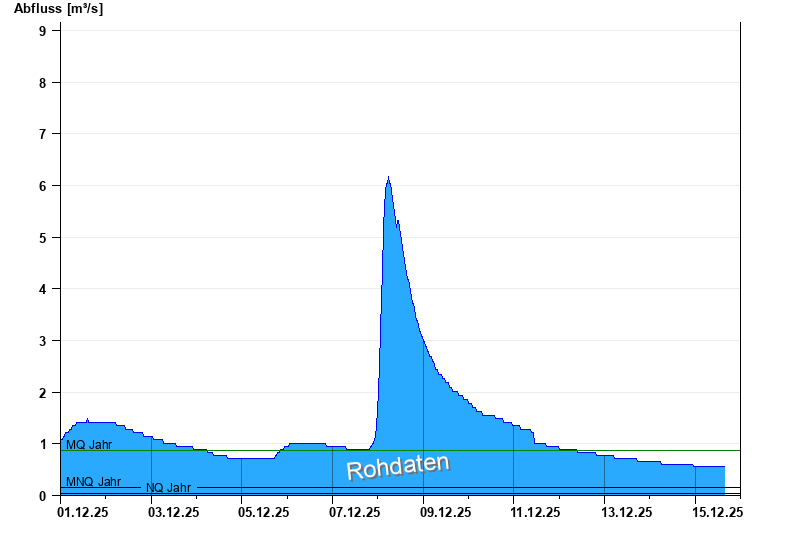
Chart of month Raisting / Rott
Discharge from 01.12.2025 to 15.12.2025
note
Messwerte beeinflusst durch Kraftwerkssteuerung.
- Niedrigwasserabfluss NQ 0,03 m³/s
- Mittlerer Niedrigwasserabfluss MNQ 0,162 m³/s
- Mittlerer Abfluss MQ 0,874 m³/s
- Mittlerer Hochwasserabfluss MHQ 26,8 m³/s
- Hochwasserabfluss HQ 84,1 m³/s
| Date | Runoff [m³/s] |
|---|---|
| 15.12.2025 14:00 | 0.556 |
| 15.12.2025 13:45 | 0.556 |
| 15.12.2025 13:30 | 0.556 |
| 15.12.2025 13:15 | 0.556 |
| 15.12.2025 13:00 | 0.556 |
| 15.12.2025 12:45 | 0.556 |
| 15.12.2025 12:30 | 0.556 |
© Bayerisches Landesamt für Umwelt 2025