

Chart of year Raisting / Rott
Discharge from 23.08.2019 to 22.08.2020
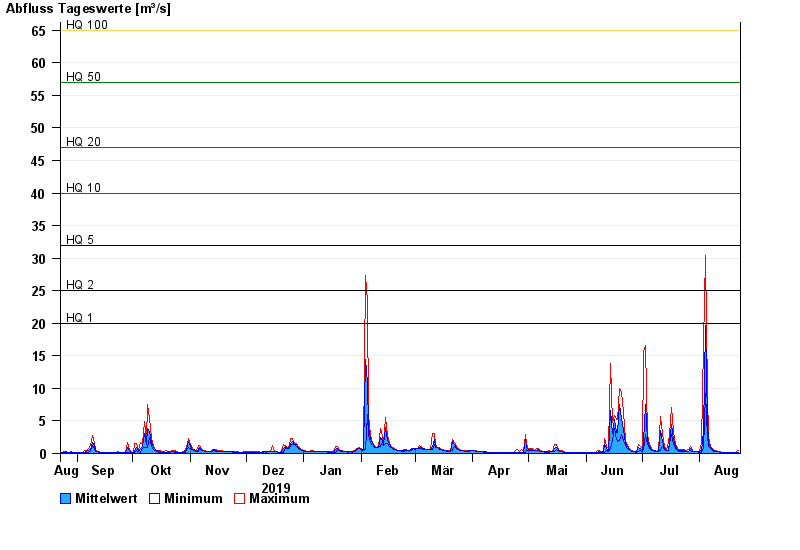
- HQ1 20 m³/s
- HQ2 25 m³/s
- HQ5 32 m³/s
- HQ10 40 m³/s
- HQ20 47 m³/s
- HQ50 57 m³/s
- HQ100 65 m³/s
| Date | Mean value [m³/s] | Maximum [m³/s] | Minimum [m³/s] |
|---|---|---|---|
| 22.08.2020 | 0.221 | 0.412 | 0.111 |
| 21.08.2020 | 0.197 | 0.267 | 0.127 |
| 20.08.2020 | 0.185 | 0.211 | 0.145 |
| 19.08.2020 | 0.155 | 0.164 | 0.145 |
| 18.08.2020 | 0.145 | 0.145 | 0.145 |
| 17.08.2020 | 0.162 | 0.186 | 0.145 |
| 16.08.2020 | 0.185 | 0.187 | 0.165 |
© Bayerisches Landesamt für Umwelt 2024