

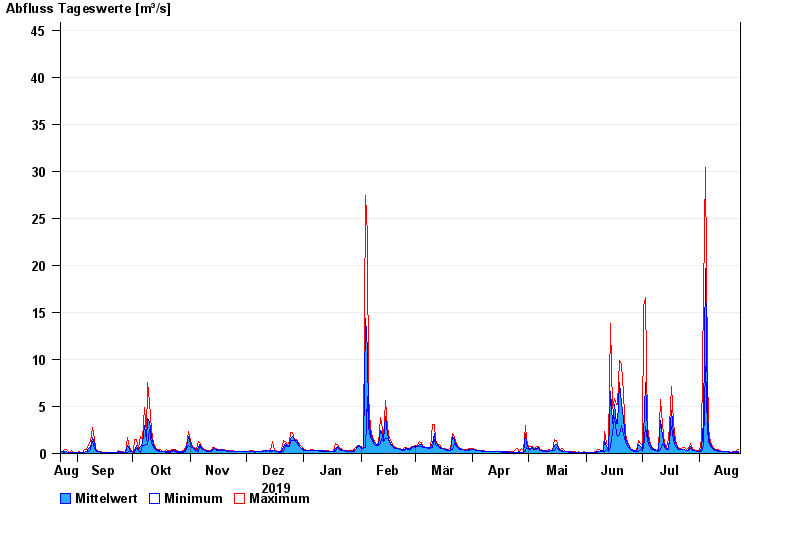
Chart of year Raisting / Rott
Discharge from 23.08.2019 to 22.08.2020
- 21.05.1999 Abfluss: 84,1 m³/s
- 18.06.1986 Abfluss: 77,7 m³/s
- 01.09.2002 Abfluss: 71 m³/s
- 29.05.2007 Abfluss: 51,5 m³/s
- 06.08.2000 Abfluss: 50,2 m³/s
| Date | Mean value [m³/s] | Maximum [m³/s] | Minimum [m³/s] |
|---|---|---|---|
| 22.08.2020 | 0.221 | 0.412 | 0.111 |
| 21.08.2020 | 0.197 | 0.267 | 0.127 |
| 20.08.2020 | 0.185 | 0.211 | 0.145 |
| 19.08.2020 | 0.155 | 0.164 | 0.145 |
| 18.08.2020 | 0.145 | 0.145 | 0.145 |
| 17.08.2020 | 0.162 | 0.186 | 0.145 |
| 16.08.2020 | 0.185 | 0.187 | 0.165 |
© Bayerisches Landesamt für Umwelt 2024