
- Start >
- Rivers >
- Discharge >
- Isar >
- Rosenheim o.d. Mangfallmündung >
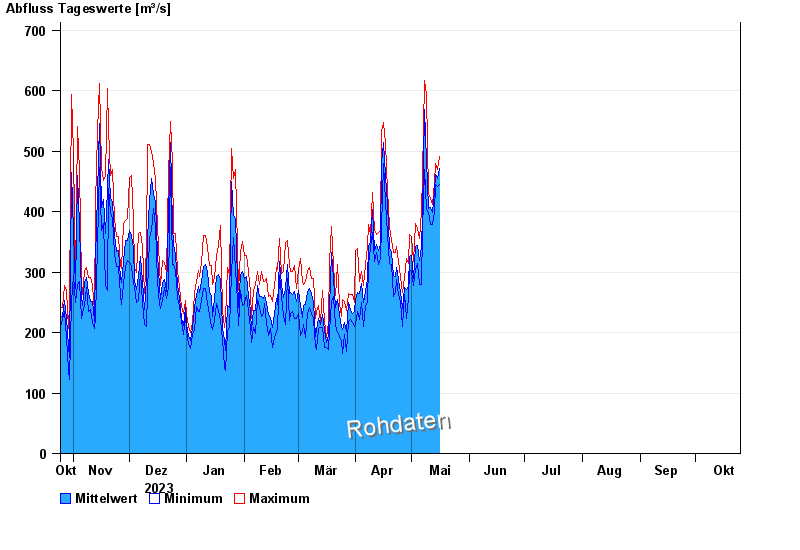
- Chart of year

Chart of year Rosenheim o.d. Mangfallmündung / Inn
Discharge from 25.10.2023 to 24.10.2024
| Date | Mean value [m³/s] | Maximum [m³/s] | Minimum [m³/s] |
|---|---|---|---|
| 17.10.2024 | 368 | 388 | 348 |
| 16.10.2024 | 435 | 501 | 380 |
| 15.10.2024 | 554 | 586 | 496 |
| 14.10.2024 | 498 | 546 | 466 |
| 13.10.2024 | 497 | 533 | 470 |
| 12.10.2024 | 568 | 628 | 520 |
| 11.10.2024 | 621 | 696 | 548 |
© Bayerisches Landesamt für Umwelt 2024