
- Start >
- Rivers >
- Discharge >
- Isar >
- Teisendorf >
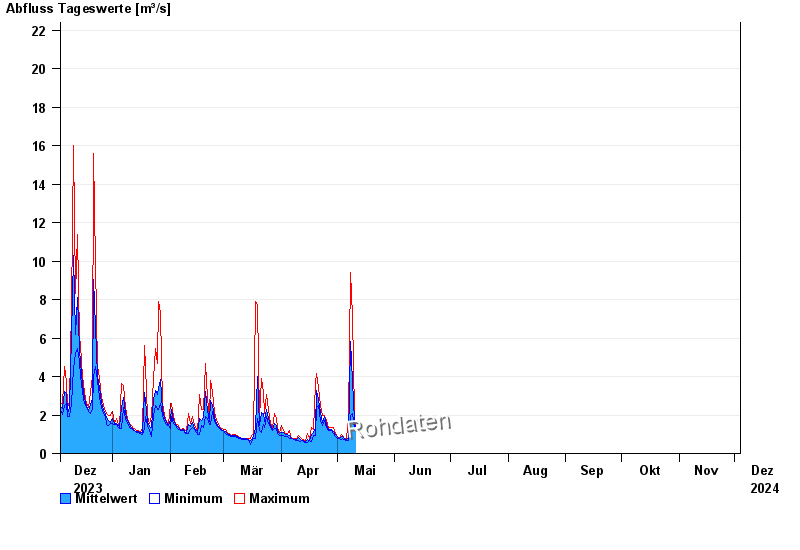
- Chart of year

Chart of year Teisendorf / Sur
Discharge from 04.12.2023 to 03.12.2024
- 04.08.2020 Abfluss: 92 m³/s
- 12.08.2002 Abfluss: 79,6 m³/s
- 02.06.2013 Abfluss: 57,8 m³/s
- 26.06.1995 Abfluss: 53,8 m³/s
- 12.06.1971 Abfluss: 53 m³/s
| Date | Mean value [m³/s] | Maximum [m³/s] | Minimum [m³/s] |
|---|---|---|---|
| 12.07.2024 | 0.744 | 0.784 | 0.738 |
| 11.07.2024 | 0.908 | 1.34 | 0.738 |
| 10.07.2024 | 0.974 | 2.56 | 0.653 |
| 09.07.2024 | 0.725 | 0.784 | 0.653 |
| 08.07.2024 | 0.837 | 0.981 | 0.738 |
| 07.07.2024 | 0.962 | 1.15 | 0.784 |
| 06.07.2024 | 0.723 | 0.784 | 0.653 |
© Bayerisches Landesamt für Umwelt 2024