

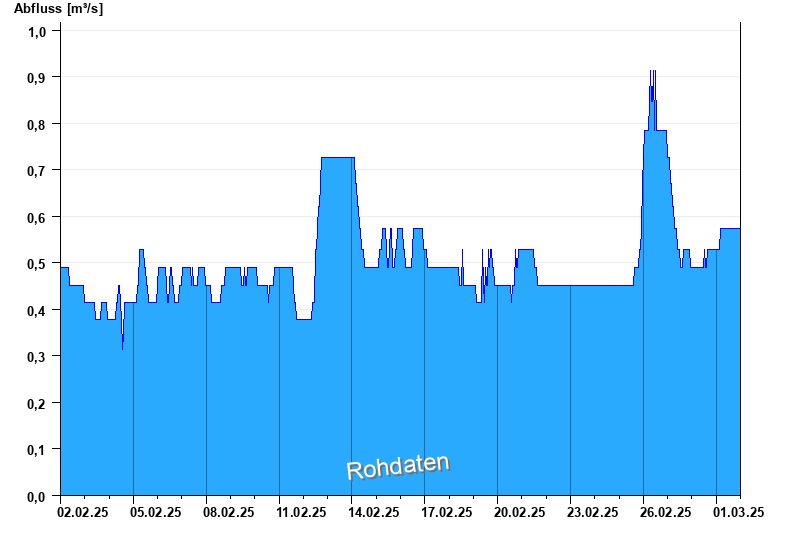
Chart of month Unternogg / Halbammer
Discharge from 02.02.2025 to 01.03.2025
- 21.05.1999 Abfluss: 134 m³/s
- 17.07.1993 Abfluss: 123 m³/s
- 23.08.2005 Abfluss: 92,6 m³/s
- 24.06.1992 Abfluss: 71 m³/s
- 06.08.2000 Abfluss: 66,8 m³/s
| Date | Runoff [m³/s] |
|---|---|
| 01.03.2025 23:45 | 0.575 |
| 01.03.2025 23:30 | 0.575 |
| 01.03.2025 23:15 | 0.575 |
| 01.03.2025 23:00 | 0.575 |
| 01.03.2025 22:45 | 0.575 |
| 01.03.2025 22:30 | 0.575 |
| 01.03.2025 22:15 | 0.575 |
© Bayerisches Landesamt für Umwelt 2025