

Chart of year Winkl / Verlorener Bach
Discharge from 01.01.2024 to 31.12.2024
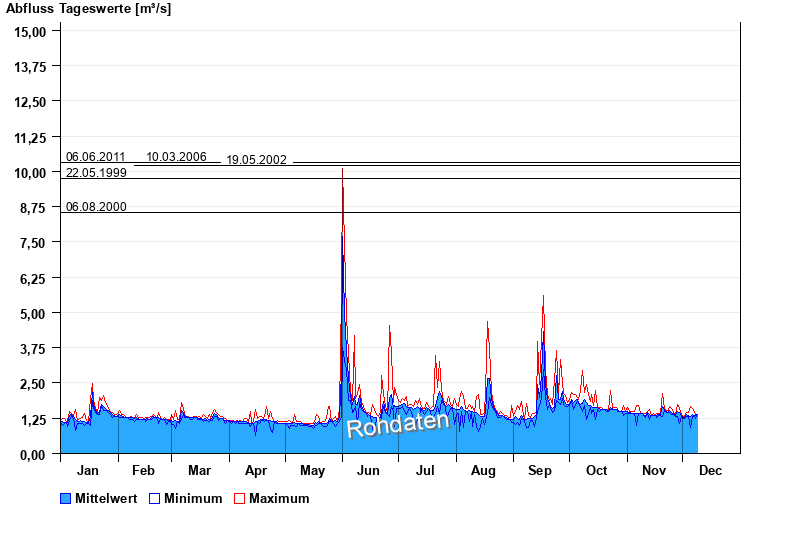
- 06.06.2011 Abfluss: 10,3 m³/s
- 10.03.2006 Abfluss: 10,3 m³/s
- 19.05.2002 Abfluss: 10,2 m³/s
- 06.08.2000 Abfluss: 8,53 m³/s
- 21.09.2000 Abfluss: 8,17 m³/s
| Date | Mean value [m³/s] | Maximum [m³/s] | Minimum [m³/s] |
|---|---|---|---|
| 16.10.2024 | 1.63 | 1.63 | 1.63 |
| 15.10.2024 | 1.64 | 2.25 | 1.22 |
| 14.10.2024 | 1.64 | 1.71 | 1.56 |
| 13.10.2024 | 1.68 | 2.08 | 1.42 |
| 12.10.2024 | 1.71 | 1.84 | 1.63 |
| 11.10.2024 | 1.71 | 2.08 | 1.42 |
| 10.10.2024 | 1.79 | 2.43 | 1.22 |
© Bayerisches Landesamt für Umwelt 2024