
- Start >
- Rivers >
- Discharge >
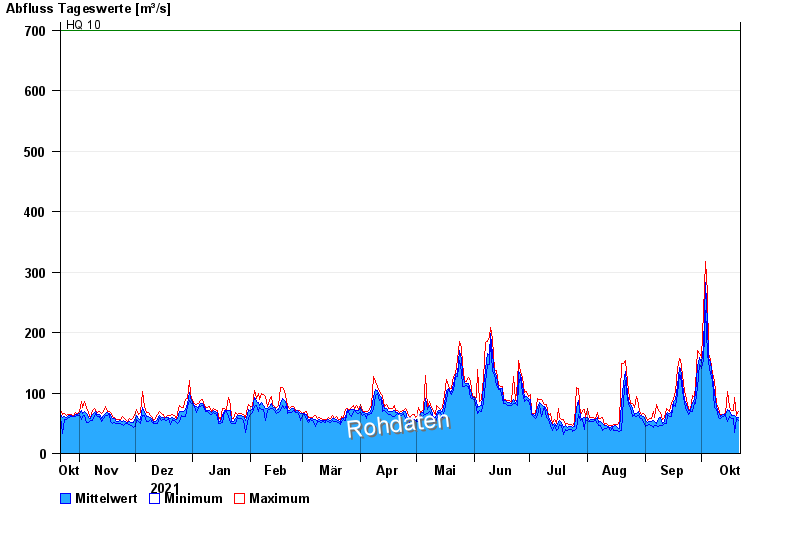
- Obere Donau >
- Augsburg u. d. Wertachmündung >
- Chart of year

Chart of year Augsburg u. d. Wertachmündung / Lech
Discharge from 22.10.2021 to 21.10.2022
note
Abflussermittlung bei Hochwasser durch Geschiebeverlagerung beeinflusst
- HQ10 700 m³/s
- HQ100 1350 m³/s
| Date | Mean value [m³/s] | Maximum [m³/s] | Minimum [m³/s] |
|---|---|---|---|
| 21.10.2022 | 59.8 | 69.7 | 54.2 |
| 20.10.2022 | 59.6 | 63.2 | 57.2 |
| 19.10.2022 | 63.6 | 92.3 | 34.9 |
| 18.10.2022 | 63.2 | 71.3 | 58.6 |
| 17.10.2022 | 63.2 | 71.3 | 58.6 |
| 16.10.2022 | 71.3 | 76.3 | 61.7 |
| 15.10.2022 | 73.2 | 102 | 52.7 |
© Bayerisches Landesamt für Umwelt 2024