
- Start >
- Rivers >
- Discharge >
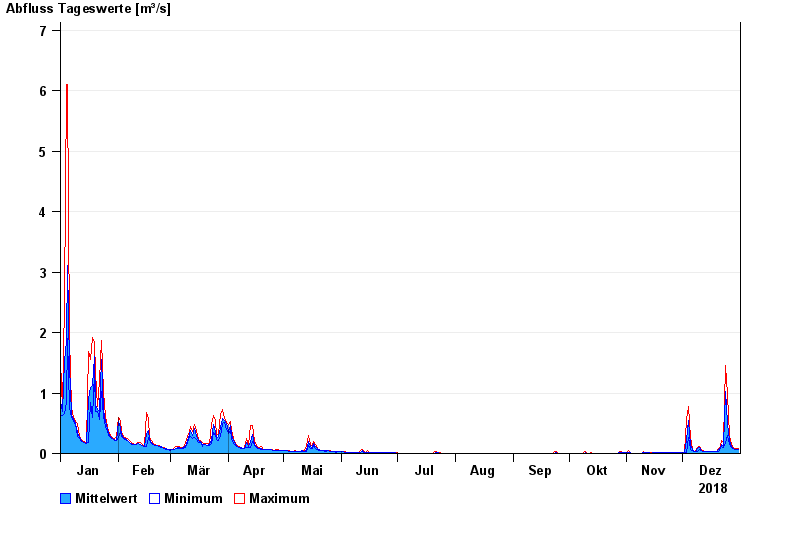
- Obere Donau >
- Binzwangen >
- Chart of year

Chart of year Binzwangen / Altmühl
Discharge from 01.01.2018 to 31.12.2018
note
Wasserstand und Abfluss wird zeitweise durch Biberdamm beeinflusst.
| Date | Mean value [m³/s] | Maximum [m³/s] | Minimum [m³/s] |
|---|---|---|---|
| 31.12.2018 | 0.073 | 0.075 | 0.072 |
| 30.12.2018 | 0.072 | 0.075 | 0.068 |
| 29.12.2018 | 0.071 | 0.079 | 0.068 |
| 28.12.2018 | 0.089 | 0.105 | 0.079 |
| 27.12.2018 | 0.123 | 0.146 | 0.105 |
| 26.12.2018 | 0.208 | 0.304 | 0.146 |
| 25.12.2018 | 0.501 | 0.972 | 0.304 |
© Bayerisches Landesamt für Umwelt 2025