
- Start >
- Rivers >
- Discharge >
- Obere Donau >
- Blumenthal >
- Chart of year

Chart of year Blumenthal / Ecknach
Discharge from 24.08.2018 to 23.08.2019
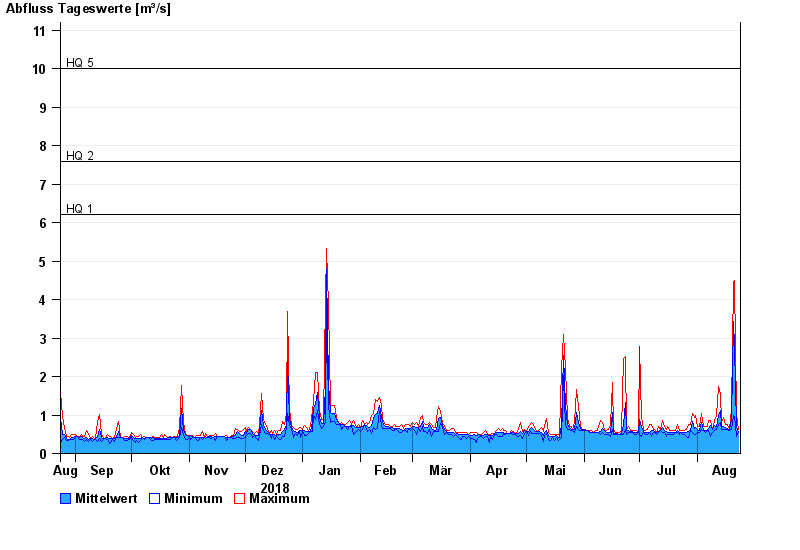
- HQ1 6,2 m³/s
- HQ2 7,6 m³/s
- HQ5 10 m³/s
- HQ10 13 m³/s
- HQ20 16,5 m³/s
- HQ50 21 m³/s
- HQ100 25 m³/s
| Date | Mean value [m³/s] | Maximum [m³/s] | Minimum [m³/s] |
|---|---|---|---|
| 23.08.2019 | 0.553 | 0.616 | 0.549 |
| 22.08.2019 | 0.712 | 1.02 | 0.451 |
| 21.08.2019 | 2.78 | 4.5 | 0.958 |
| 20.08.2019 | 3.44 | 4.44 | 0.987 |
| 19.08.2019 | 0.894 | 1.17 | 0.635 |
| 18.08.2019 | 0.617 | 0.635 | 0.585 |
| 17.08.2019 | 0.647 | 0.75 | 0.635 |
© Bayerisches Landesamt für Umwelt 2024