
- Start >
- Rivers >
- Discharge >
- Obere Donau >
- Blumenthal >
- Chart of year

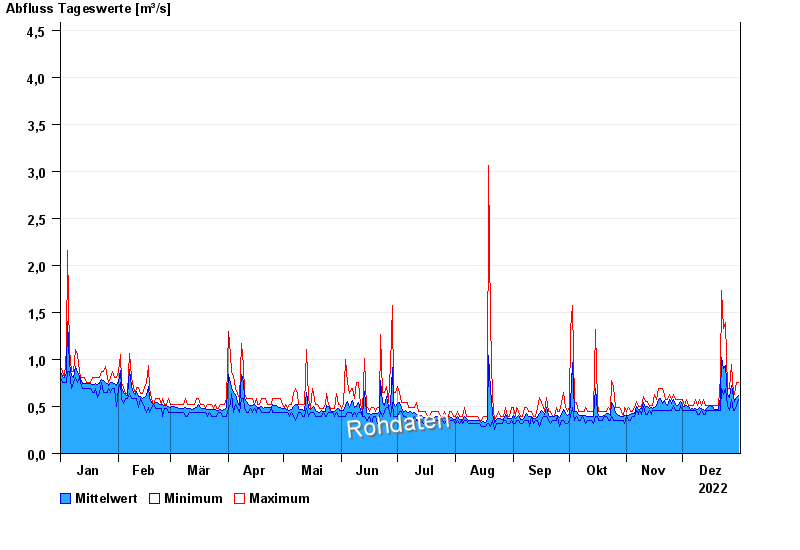
Chart of year Blumenthal / Ecknach
Discharge from 01.01.2022 to 31.12.2022
- 02.06.2013 Abfluss: 20,4 m³/s
- 23.08.2005 Abfluss: 19,7 m³/s
- 13.04.1994 Abfluss: 17 m³/s
- 15.02.1990 Abfluss: 15,9 m³/s
- 22.09.2000 Abfluss: 14,8 m³/s
| Date | Mean value [m³/s] | Maximum [m³/s] | Minimum [m³/s] |
|---|---|---|---|
| 31.12.2022 | 0.719 | 0.87 | 0.632 |
| 30.12.2022 | 0.683 | 0.87 | 0.632 |
| 29.12.2022 | 0.634 | 0.708 | 0.56 |
| 28.12.2022 | 0.691 | 0.787 | 0.56 |
| 27.12.2022 | 0.875 | 1.13 | 0.708 |
| 26.12.2022 | 0.678 | 0.787 | 0.491 |
| 25.12.2022 | 0.744 | 0.869 | 0.559 |
© Bayerisches Landesamt für Umwelt 2025