
- Start >
- Rivers >
- Discharge >
- Obere Donau >
- Blumenthal >
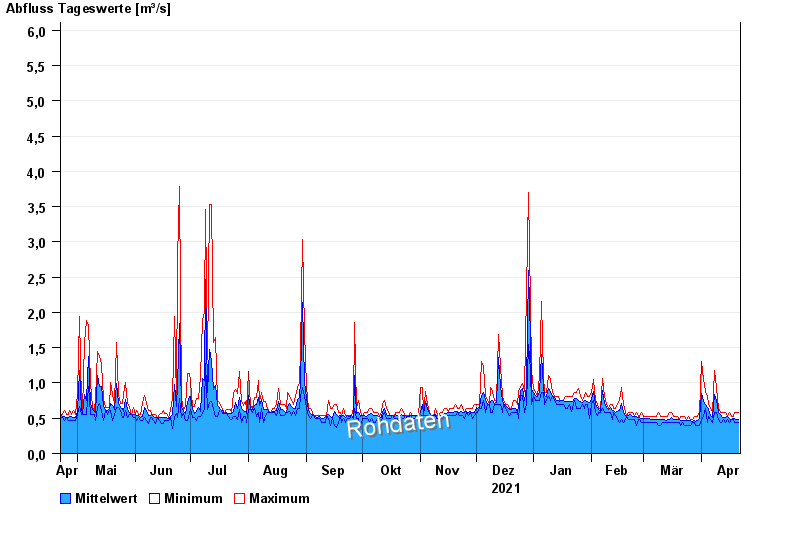
- Chart of year

Chart of year Blumenthal / Ecknach
Discharge from 22.04.2021 to 21.04.2022
- 23.08.2005 Abfluss: 21,5 m³/s
- 02.06.2013 Abfluss: 20,4 m³/s
- 13.04.1994 Abfluss: 18,4 m³/s
- 15.02.1990 Abfluss: 17,5 m³/s
- 22.09.2000 Abfluss: 14,8 m³/s
| Date | Mean value [m³/s] | Maximum [m³/s] | Minimum [m³/s] |
|---|---|---|---|
| 21.04.2022 | 0.489 | 0.58 | 0.435 |
| 20.04.2022 | 0.481 | 0.58 | 0.435 |
| 19.04.2022 | 0.496 | 0.58 | 0.435 |
| 18.04.2022 | 0.491 | 0.525 | 0.481 |
| 17.04.2022 | 0.487 | 0.525 | 0.481 |
| 16.04.2022 | 0.501 | 0.58 | 0.435 |
| 15.04.2022 | 0.519 | 0.525 | 0.481 |
© Bayerisches Landesamt für Umwelt 2024