
- Start >
- Rivers >
- Discharge >
- Obere Donau >
- Blumenthal >
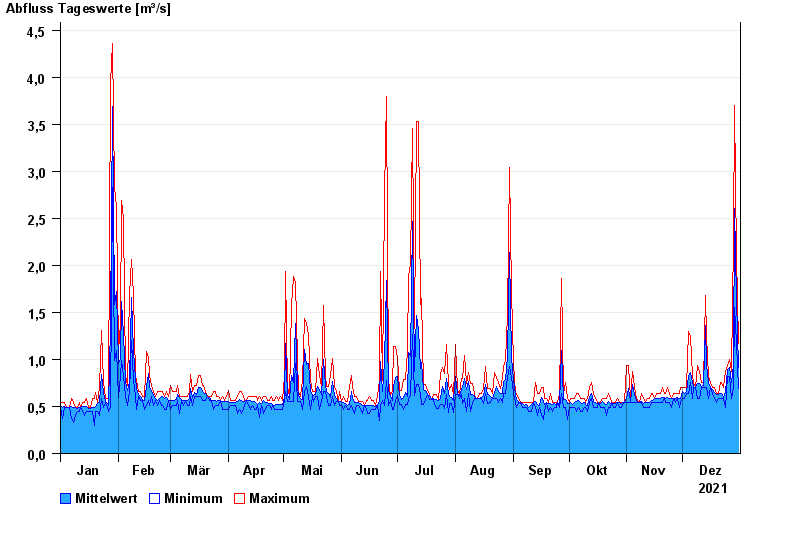
- Chart of year

Chart of year Blumenthal / Ecknach
Discharge from 01.01.2021 to 31.12.2021
| Date | Mean value [m³/s] | Maximum [m³/s] | Minimum [m³/s] |
|---|---|---|---|
| 31.12.2021 | 0.913 | 1.17 | 0.696 |
| 30.12.2021 | 1.63 | 2.04 | 1.17 |
| 29.12.2021 | 2.43 | 3.33 | 1.55 |
| 28.12.2021 | 0.944 | 2.19 | 0.699 |
| 27.12.2021 | 0.751 | 0.876 | 0.586 |
| 26.12.2021 | 0.915 | 0.997 | 0.816 |
| 25.12.2021 | 0.897 | 0.936 | 0.816 |
© Bayerisches Landesamt für Umwelt 2025