
- Start >
- Rivers >
- Discharge >
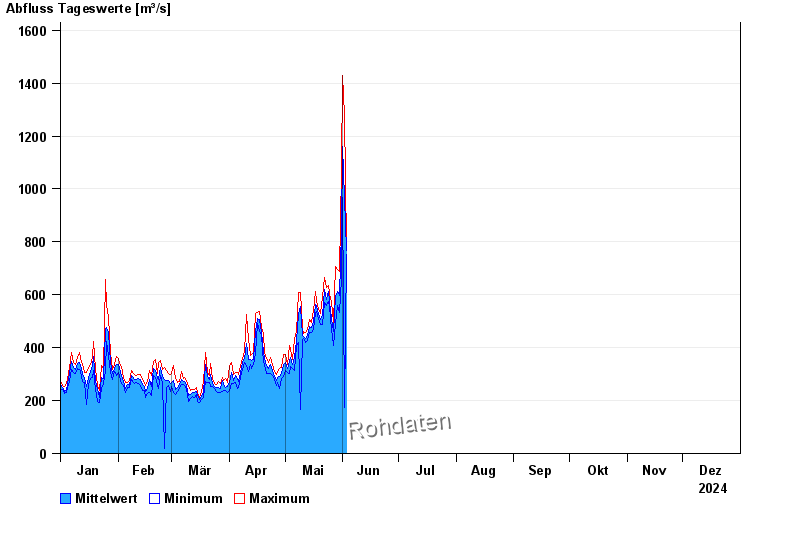
- Obere Donau >
- Eschelbach Q >
- Chart of year

Chart of year Eschelbach Q / Inn
Discharge from 01.01.2024 to 31.12.2024
 Für diesen Pegel sind keine Hauptwerte hinterlegt.
| Date | Mean value [m³/s] | Maximum [m³/s] | Minimum [m³/s] |
|---|---|---|---|
| 31.12.2024 | 185 | 209 | 164 |
| 30.12.2024 | 194 | 218 | 160 |
| 29.12.2024 | 188 | 205 | 174 |
| 28.12.2024 | 185 | 205 | 89.4 |
| 27.12.2024 | 157 | 171 | 151 |
| 26.12.2024 | 168 | 180 | 154 |
| 25.12.2024 | 179 | 189 | 166 |
© Bayerisches Landesamt für Umwelt 2024