
- Start >
- Rivers >
- Discharge >
- Obere Donau >
- Freising >
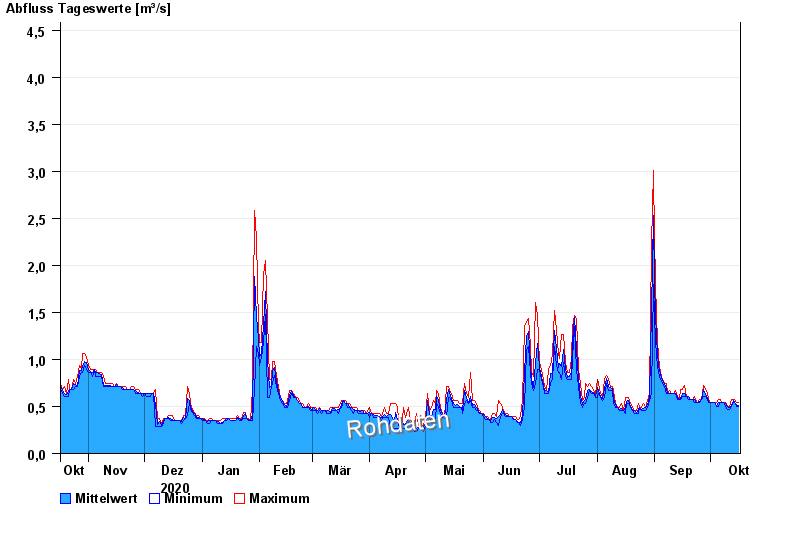
- Chart of year

Chart of year Freising / Schleifermoosach
Discharge from 17.10.2020 to 16.10.2021
- 02.06.2013 Abfluss: 16,1 m³/s
- 24.08.2005 Abfluss: 10,9 m³/s
- 23.05.1999 Abfluss: 9,37 m³/s
- 12.08.2002 Abfluss: 8,15 m³/s
- 02.06.1995 Abfluss: 7,97 m³/s
| Date | Mean value [m³/s] | Maximum [m³/s] | Minimum [m³/s] |
|---|---|---|---|
| 16.10.2021 | 0.442 | 0.449 | 0.434 |
| 15.10.2021 | 0.441 | 0.453 | 0.432 |
| 14.10.2021 | 0.467 | 0.496 | 0.453 |
| 13.10.2021 | 0.483 | 0.497 | 0.454 |
| 12.10.2021 | 0.438 | 0.486 | 0.419 |
| 11.10.2021 | 0.415 | 0.437 | 0.406 |
| 10.10.2021 | 0.416 | 0.43 | 0.409 |
© Bayerisches Landesamt für Umwelt 2024