
- Start >
- Rivers >
- Discharge >
- Obere Donau >
- Freising >
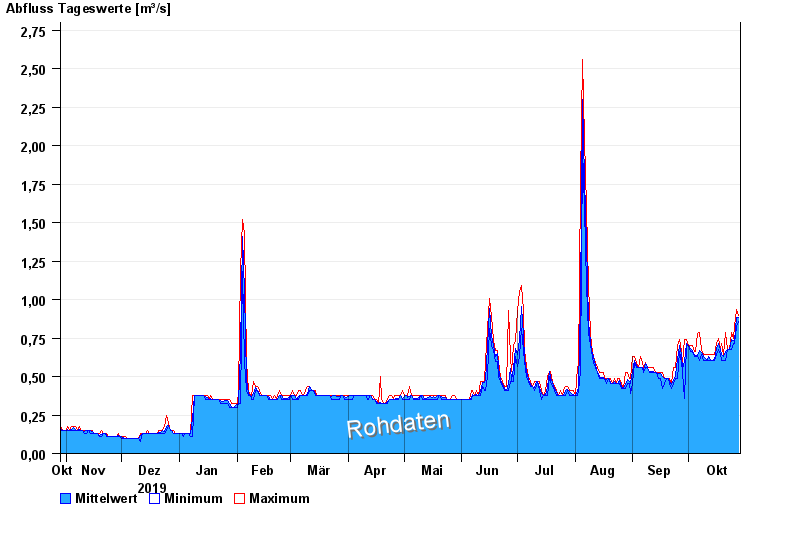
- Chart of year

Chart of year Freising / Schleifermoosach
Discharge from 29.10.2019 to 28.10.2020
| Date | Mean value [m³/s] | Maximum [m³/s] | Minimum [m³/s] |
|---|---|---|---|
| 28.10.2020 | 0.923 | 0.946 | 0.888 |
| 27.10.2020 | 0.922 | 0.975 | 0.844 |
| 26.10.2020 | 0.743 | 0.852 | 0.72 |
| 25.10.2020 | 0.749 | 0.771 | 0.728 |
| 24.10.2020 | 0.762 | 0.823 | 0.704 |
| 23.10.2020 | 0.691 | 0.704 | 0.676 |
| 22.10.2020 | 0.689 | 0.7 | 0.676 |
© Bayerisches Landesamt für Umwelt 2024