
- Start >
- Rivers >
- Discharge >
- Obere Donau >
- Harburg >
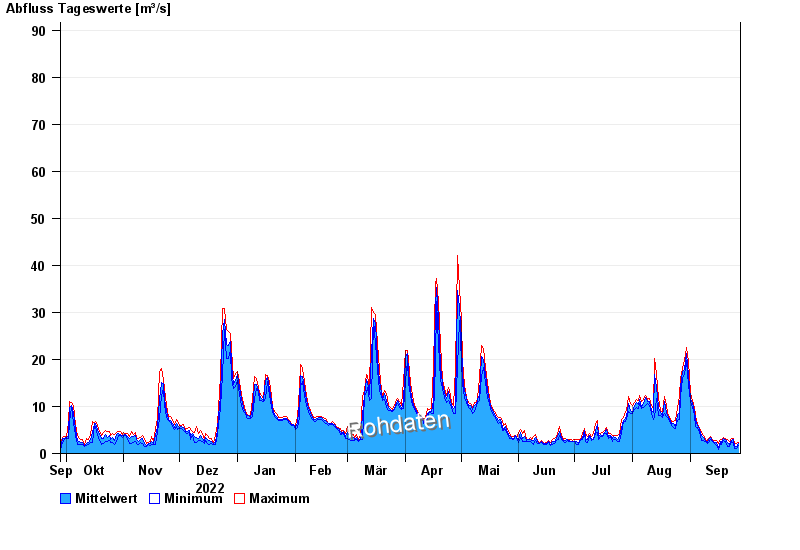
- Chart of year

Chart of year Harburg / Wörnitz
Discharge from 28.09.2022 to 27.09.2023
- HQ1 100 m³/s
- HQ2 150 m³/s
- HQ5 220 m³/s
- HQ10 270 m³/s
- HQ20 320 m³/s
- HQ50 395 m³/s
- HQ100 450 m³/s
| Date | Mean value [m³/s] | Maximum [m³/s] | Minimum [m³/s] |
|---|---|---|---|
| 27.09.2023 | 2.11 | 2.43 | 1.65 |
| 26.09.2023 | 1.44 | 2.04 | 1.1 |
| 25.09.2023 | 1.36 | 2.04 | 1.1 |
| 24.09.2023 | 3.01 | 3.25 | 2.04 |
| 23.09.2023 | 2.8 | 3.25 | 2.63 |
| 22.09.2023 | 1.96 | 2.63 | 1.46 |
| 21.09.2023 | 2.36 | 3.04 | 1.46 |
© Bayerisches Landesamt für Umwelt 2024