
- Start >
- Rivers >
- Discharge >
- Obere Donau >
- Hasberg >
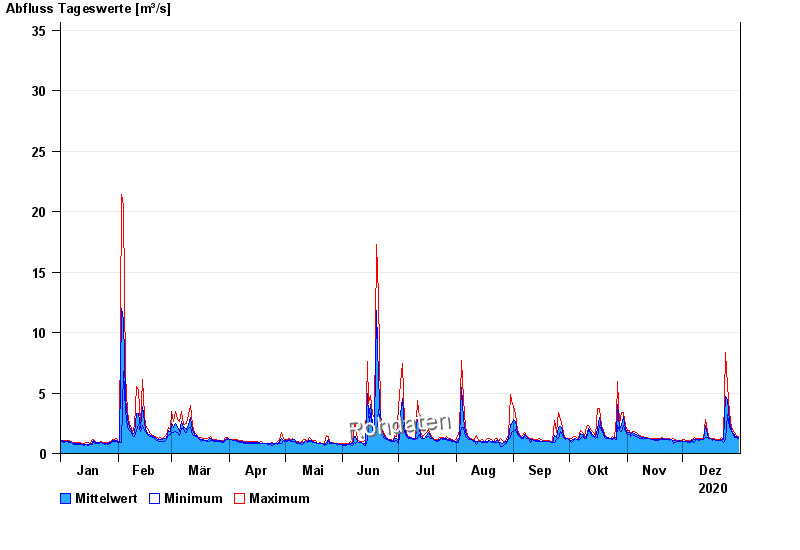
- Chart of year

Chart of year Hasberg / Mindel
Discharge from 01.01.2020 to 31.12.2020
- 01.06.2024 Abfluss: 77,6 m³/s
- 07.06.2002 Abfluss: 61 m³/s
- 14.04.1994 Abfluss: 56,8 m³/s
- 12.08.2002 Abfluss: 55,9 m³/s
- 22.05.1999 Abfluss: 53,8 m³/s
| Date | Mean value [m³/s] | Maximum [m³/s] | Minimum [m³/s] |
|---|---|---|---|
| 31.12.2020 | 1.24 | 1.34 | 1.17 |
| 30.12.2020 | 1.33 | 1.44 | 1.26 |
| 29.12.2020 | 1.42 | 1.63 | 1.26 |
| 28.12.2020 | 1.59 | 1.74 | 1.53 |
| 27.12.2020 | 1.86 | 2.08 | 1.63 |
| 26.12.2020 | 2.64 | 3.45 | 2.08 |
| 25.12.2020 | 4.61 | 5.87 | 3.45 |
© Bayerisches Landesamt für Umwelt 2025