
- Start >
- Rivers >
- Discharge >
- Obere Donau >
- Heitzenhofen >
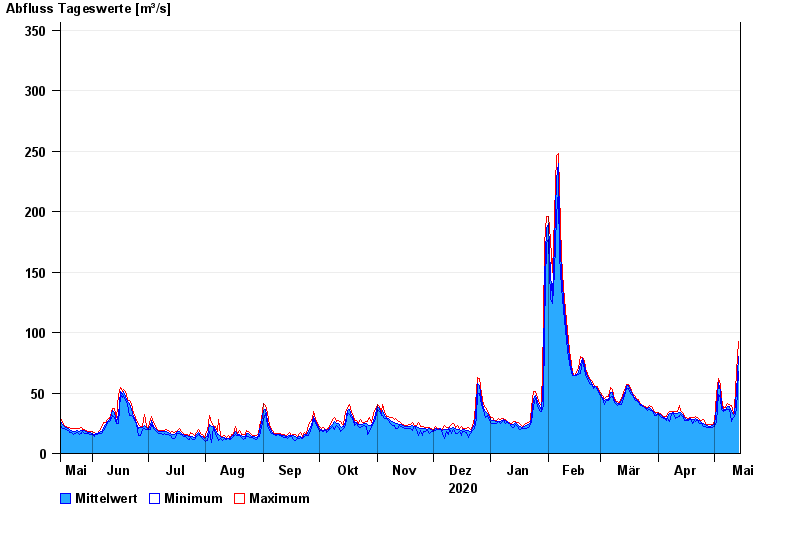
- Chart of year

Chart of year Heitzenhofen / Naab
Discharge from 15.05.2020 to 14.05.2021
- 06.02.1909 Abfluss: 950 m³/s
- 30.12.1947 Abfluss: 765 m³/s
- 12.07.1954 Abfluss: 730 m³/s
- 16.01.2011 Abfluss: 715 m³/s
- 28.03.1988 Abfluss: 611 m³/s
| Date | Mean value [m³/s] | Maximum [m³/s] | Minimum [m³/s] |
|---|---|---|---|
| 14.05.2021 | 80.1 | 92.8 | 68.2 |
| 13.05.2021 | 51.6 | 68.2 | 36.7 |
| 12.05.2021 | 33.3 | 37.2 | 30.3 |
| 11.05.2021 | 32 | 32.9 | 29.8 |
| 10.05.2021 | 34.7 | 39.4 | 26.8 |
| 09.05.2021 | 38.9 | 40.5 | 36.6 |
| 08.05.2021 | 39.1 | 41.1 | 36 |
© Bayerisches Landesamt für Umwelt 2024