
- Start >
- Rivers >
- Discharge >
- Obere Donau >
- Mainburg >
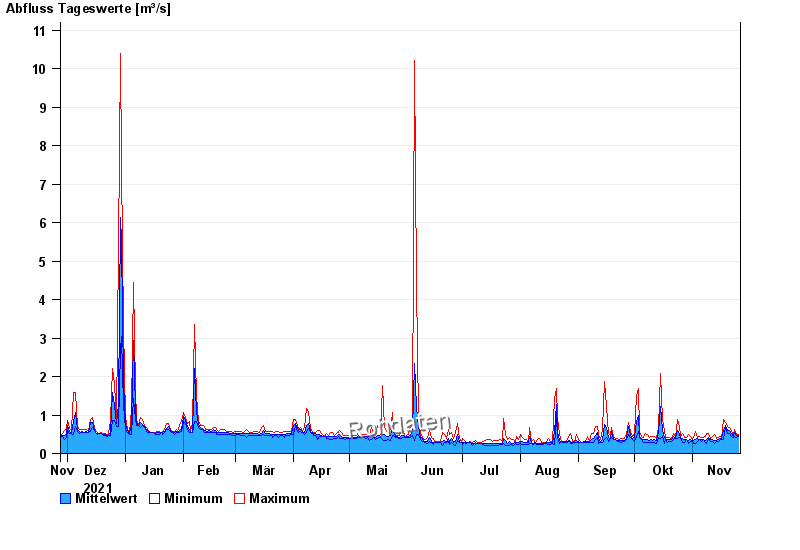
- Chart of year

Chart of year Mainburg / Abens
Discharge from 27.11.2021 to 26.11.2022
| Date | Mean value [m³/s] | Maximum [m³/s] | Minimum [m³/s] |
|---|---|---|---|
| 26.11.2022 | 0.505 | 0.531 | 0.494 |
| 25.11.2022 | 0.505 | 0.531 | 0.458 |
| 24.11.2022 | 0.592 | 0.654 | 0.494 |
| 23.11.2022 | 0.487 | 0.531 | 0.458 |
| 22.11.2022 | 0.556 | 0.611 | 0.494 |
| 21.11.2022 | 0.646 | 0.7 | 0.57 |
| 20.11.2022 | 0.633 | 0.747 | 0.57 |
© Bayerisches Landesamt für Umwelt 2025