
- Start >
- Rivers >
- Discharge >
- Obere Donau >
- Manching (Ort) >
- Chart of year

Chart of year Manching (Ort) / Paar
Discharge from 01.01.2016 to 31.12.2016
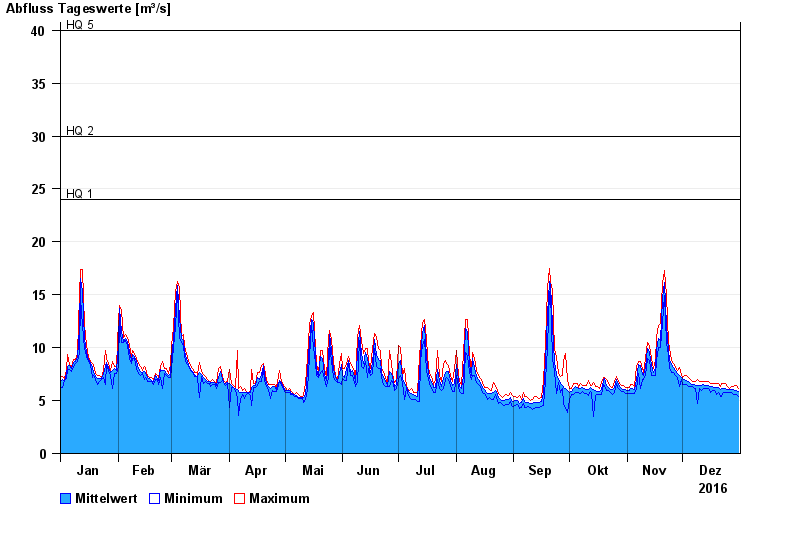
- HQ1 24 m³/s
- HQ2 30 m³/s
- HQ5 40 m³/s
- HQ10 49 m³/s
- HQ20 60 m³/s
- HQ50 77 m³/s
- HQ100 92 m³/s
| Date | Mean value [m³/s] | Maximum [m³/s] | Minimum [m³/s] |
|---|---|---|---|
| 31.12.2016 | 5.84 | 6.18 | 5.42 |
| 30.12.2016 | 5.98 | 6.38 | 5.6 |
| 29.12.2016 | 5.96 | 6.38 | 5.6 |
| 28.12.2016 | 6.04 | 6.37 | 5.6 |
| 27.12.2016 | 6.06 | 6.37 | 5.78 |
| 26.12.2016 | 6.09 | 6.17 | 5.78 |
| 25.12.2016 | 6.09 | 6.37 | 5.78 |
© Bayerisches Landesamt für Umwelt 2024