
- Start >
- Rivers >
- Discharge >
- Obere Donau >
- Moosburg >
- Chart of year

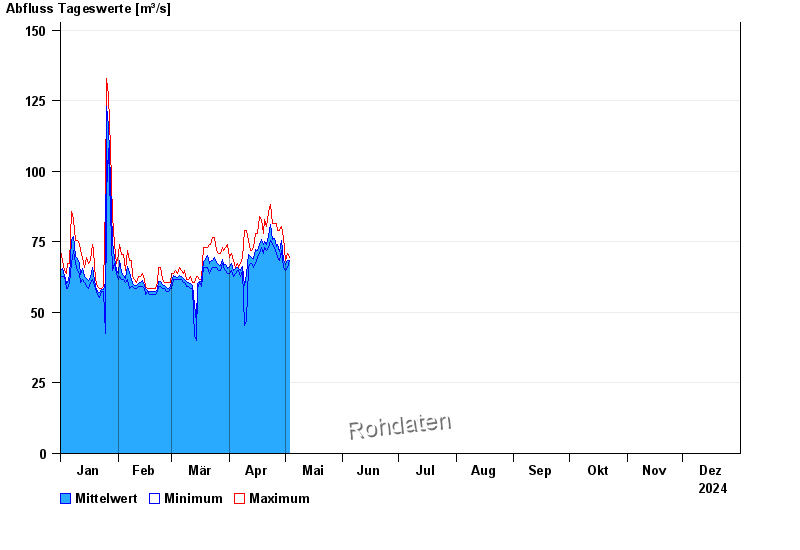
Chart of year Moosburg / Isar
Discharge from 01.01.2024 to 31.12.2024
| Date | Mean value [m³/s] | Maximum [m³/s] | Minimum [m³/s] |
|---|---|---|---|
| 26.11.2024 | 50.3 | 52 | 49 |
| 25.11.2024 | 50.6 | 56.1 | 47.1 |
| 24.11.2024 | 52.3 | 56.1 | 49 |
| 23.11.2024 | 51 | 53 | 49 |
| 22.11.2024 | 52.9 | 57.2 | 48.1 |
| 21.11.2024 | 52.5 | 63.8 | 47.1 |
| 20.11.2024 | 52.7 | 68.4 | 47.1 |
© Bayerisches Landesamt für Umwelt 2024