
- Start >
- Rivers >
- Discharge >
- Obere Donau >
- München >
- Chart of year

Chart of year München / Isar
Discharge from 01.01.2014 to 31.12.2014
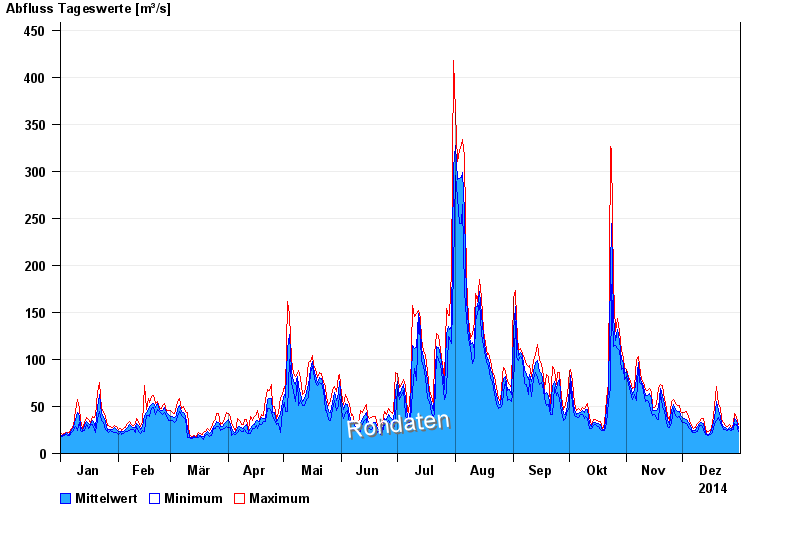
| Date | Mean value [m³/s] | Maximum [m³/s] | Minimum [m³/s] |
|---|---|---|---|
| 31.12.2014 | 25.4 | 29.9 | 22.6 |
| 30.12.2014 | 33.8 | 36.9 | 29.9 |
| 29.12.2014 | 35.8 | 41.3 | 30.4 |
| 28.12.2014 | 29 | 30.8 | 24.6 |
| 27.12.2014 | 24.6 | 26.2 | 23.5 |
| 26.12.2014 | 26.9 | 29.8 | 24.4 |
| 25.12.2014 | 24.9 | 28.3 | 23.7 |
© Bayerisches Landesamt für Umwelt 2025