
- Start >
- Rivers >
- Discharge >
- Obere Donau >
- Obermenzing >
- Chart of year

Chart of year Obermenzing / Würm
Discharge from 01.01.2024 to 31.12.2024
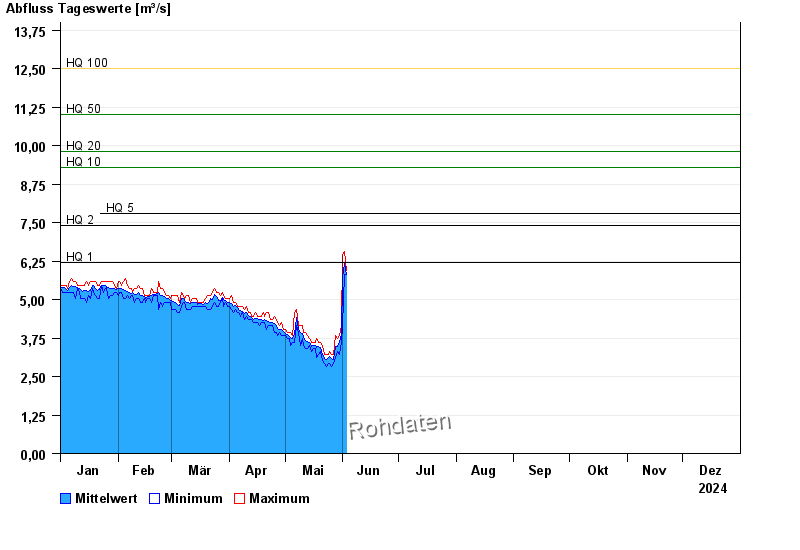
- HQ1 6,2 m³/s
- HQ2 7,4 m³/s
- HQ5 7,8 m³/s
- HQ10 9,3 m³/s
- HQ20 9,8 m³/s
- HQ50 11 m³/s
- HQ100 12,5 m³/s
| Date | Mean value [m³/s] | Maximum [m³/s] | Minimum [m³/s] |
|---|---|---|---|
| 27.12.2024 | 4.08 | 4.26 | 3.96 |
| 26.12.2024 | 4.1 | 4.26 | 3.75 |
| 25.12.2024 | 4.18 | 4.37 | 4.06 |
| 24.12.2024 | 4.26 | 4.47 | 4.06 |
| 23.12.2024 | 4.42 | 4.68 | 4.26 |
| 22.12.2024 | 4.46 | 4.68 | 4.26 |
| 21.12.2024 | 4.23 | 4.37 | 4.06 |
© Bayerisches Landesamt für Umwelt 2024