
- Start >
- Rivers >
- Discharge >
- Obere Donau >
- Obermenzing >
- Chart of year

Chart of year Obermenzing / Würm
Discharge from 01.01.2020 to 31.12.2020
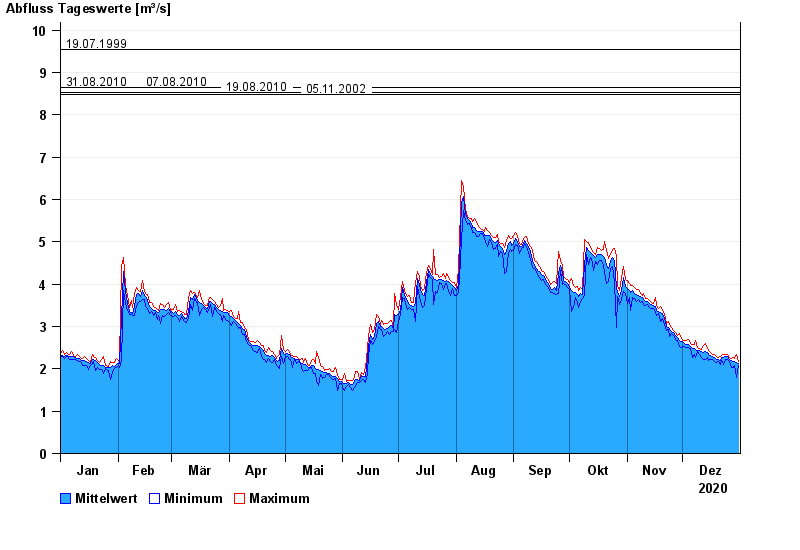
- 19.07.1999 Abfluss: 9,54 m³/s
- 31.08.2010 Abfluss: 8,64 m³/s
- 07.08.2010 Abfluss: 8,64 m³/s
- 19.08.2010 Abfluss: 8,53 m³/s
- 05.11.2002 Abfluss: 8,49 m³/s
| Date | Mean value [m³/s] | Maximum [m³/s] | Minimum [m³/s] |
|---|---|---|---|
| 31.12.2020 | 2.12 | 2.17 | 2.07 |
| 30.12.2020 | 2.14 | 2.35 | 1.8 |
| 29.12.2020 | 2.17 | 2.25 | 2.07 |
| 28.12.2020 | 2.18 | 2.26 | 2.03 |
| 27.12.2020 | 2.2 | 2.25 | 2.04 |
| 26.12.2020 | 2.23 | 2.27 | 2.17 |
| 25.12.2020 | 2.28 | 2.33 | 2.22 |
© Bayerisches Landesamt für Umwelt 2024