
- Start >
- Rivers >
- Discharge >
- Obere Donau >
- Parsberg >
- Chart of year

Chart of year Parsberg / Schwarze Laber
Discharge from 28.10.2022 to 27.10.2023
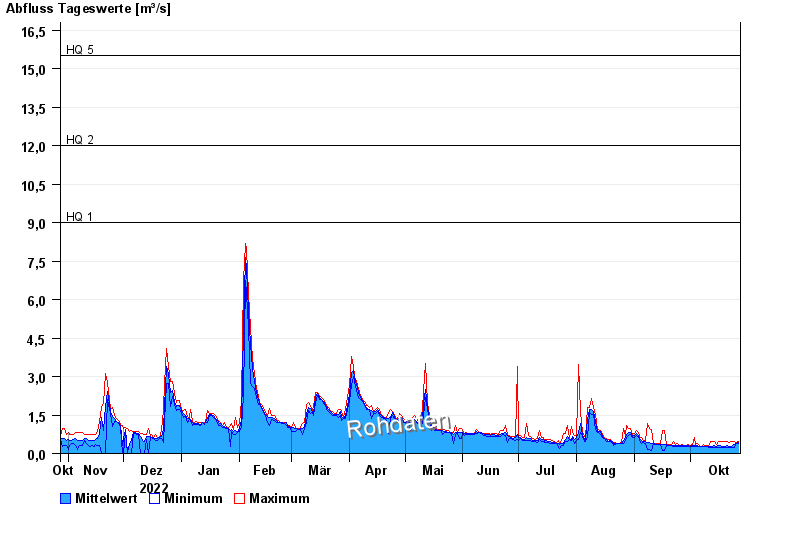
- HQ1 9 m³/s
- HQ2 12 m³/s
- HQ5 15,5 m³/s
- HQ10 19 m³/s
- HQ20 25 m³/s
- HQ50 36 m³/s
- HQ100 50 m³/s
| Date | Mean value [m³/s] | Maximum [m³/s] | Minimum [m³/s] |
|---|---|---|---|
| 27.10.2023 | 0.447 | 0.472 | 0.401 |
| 26.10.2023 | 0.407 | 0.438 | 0.371 |
| 25.10.2023 | 0.336 | 0.472 | 0.243 |
| 24.10.2023 | 0.333 | 0.472 | 0.243 |
| 23.10.2023 | 0.282 | 0.472 | 0.243 |
| 22.10.2023 | 0.282 | 0.438 | 0.243 |
| 21.10.2023 | 0.301 | 0.472 | 0.243 |
© Bayerisches Landesamt für Umwelt 2024