
- Start >
- Rivers >
- Discharge >
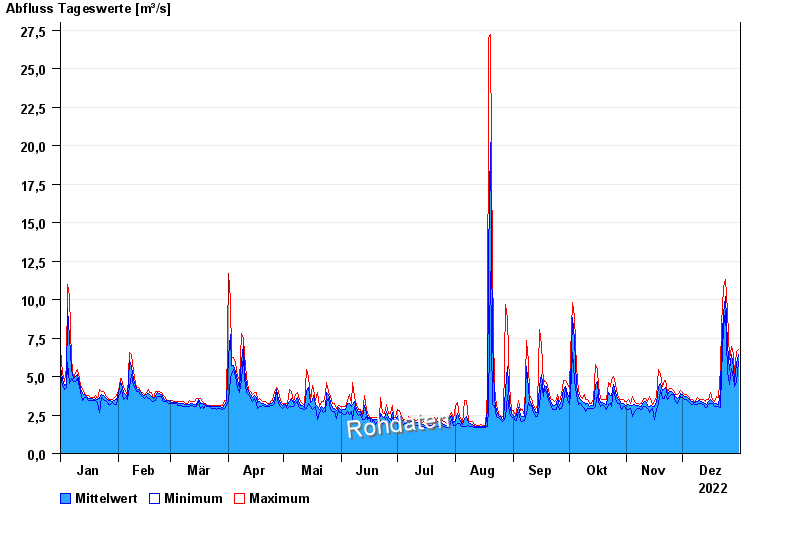
- Obere Donau >
- Pfaffenhofen >
- Chart of year

Chart of year Pfaffenhofen / Zusam
Discharge from 01.01.2022 to 31.12.2022
| Date | Mean value [m³/s] | Maximum [m³/s] | Minimum [m³/s] |
|---|---|---|---|
| 31.12.2022 | 6.23 | 6.53 | 5.72 |
| 30.12.2022 | 5.69 | 6.53 | 4.42 |
| 29.12.2022 | 4.57 | 4.98 | 4.29 |
| 28.12.2022 | 5.41 | 6.21 | 4.7 |
| 27.12.2022 | 6.3 | 6.71 | 5.43 |
| 26.12.2022 | 5.27 | 5.89 | 4.3 |
| 25.12.2022 | 6.87 | 9.03 | 5.13 |
© Bayerisches Landesamt für Umwelt 2024